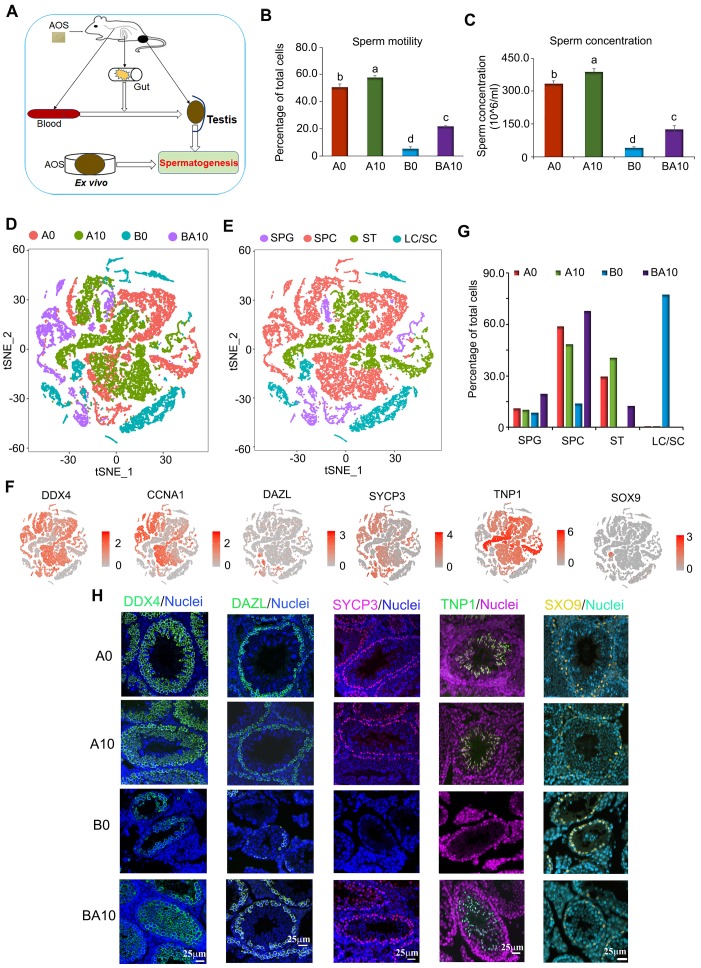
Figure 1.
Mouse sperm motility, concentration, and scRNA-seq analysis. (A) Study design. (B) Mouse sperm motility. The y-axis represents the percentage of cells. The X-axis represents the treatment (n = 30/group). a,b,c Means not sharing a common superscript are different (p < 0.05). (C) Mouse sperm concentration. The y-axis represents the concentration. The x-axis represents the treatment (n = 30/group). a,b,c Means not sharing a common superscript are different (p < 0.05). (D) scRNA-seq cell map based on tSNE for the four treatment groups. (E) Cell clusters in scRNA-seq analysis. (F) Marker genes for each cluster. (G) The proportion of cells in each cluster in every sample. (H) IHF for some of the marker genes.

