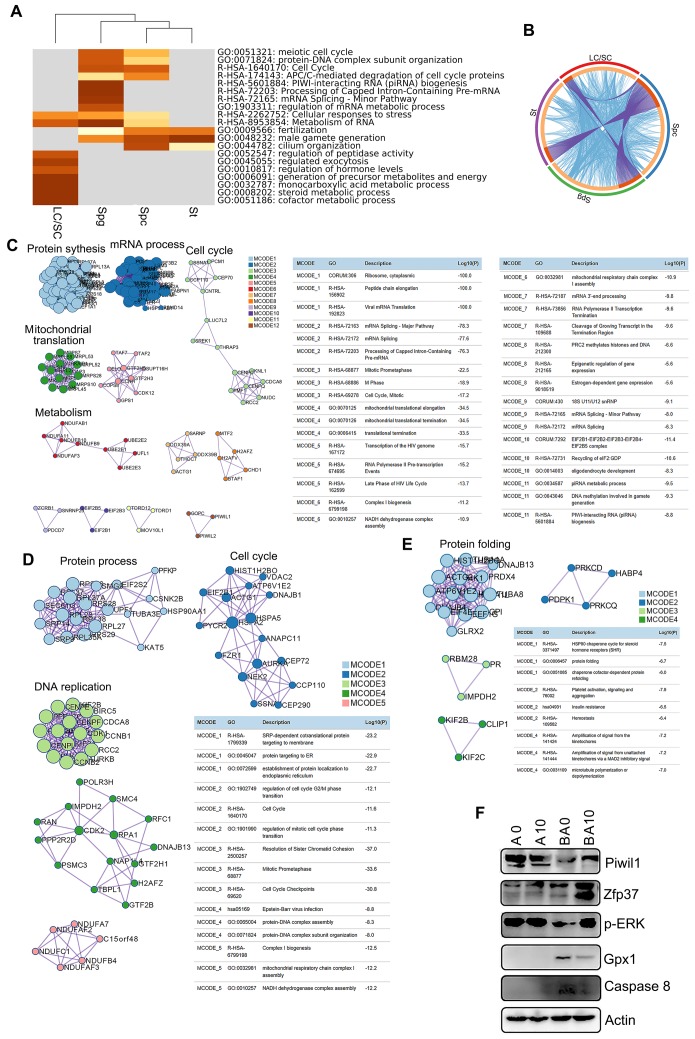
Figure 3.
Enrichment analysis and protein-protein interaction networks for scRNA-seq data. (A) Enrichment analysis for SPGs, SPCs, STs, and LCs/SCs using the online tool in Metascape. (B) Circos plots showing interaction between these clusters of cells. The shared marker genes are linked by purple lines, and similar terms are linked by blue lines. (C) Protein-protein interaction networks of marker genes in the SPG cluster. (D) Protein-protein interaction networks of marker genes in the SPC cluster. (E) Protein-protein interaction networks of marker genes in the ST cluster. (F) WB of some proteins important for spermatogenesis and maintaining cell function in mouse testis samples.

