Figure 4.
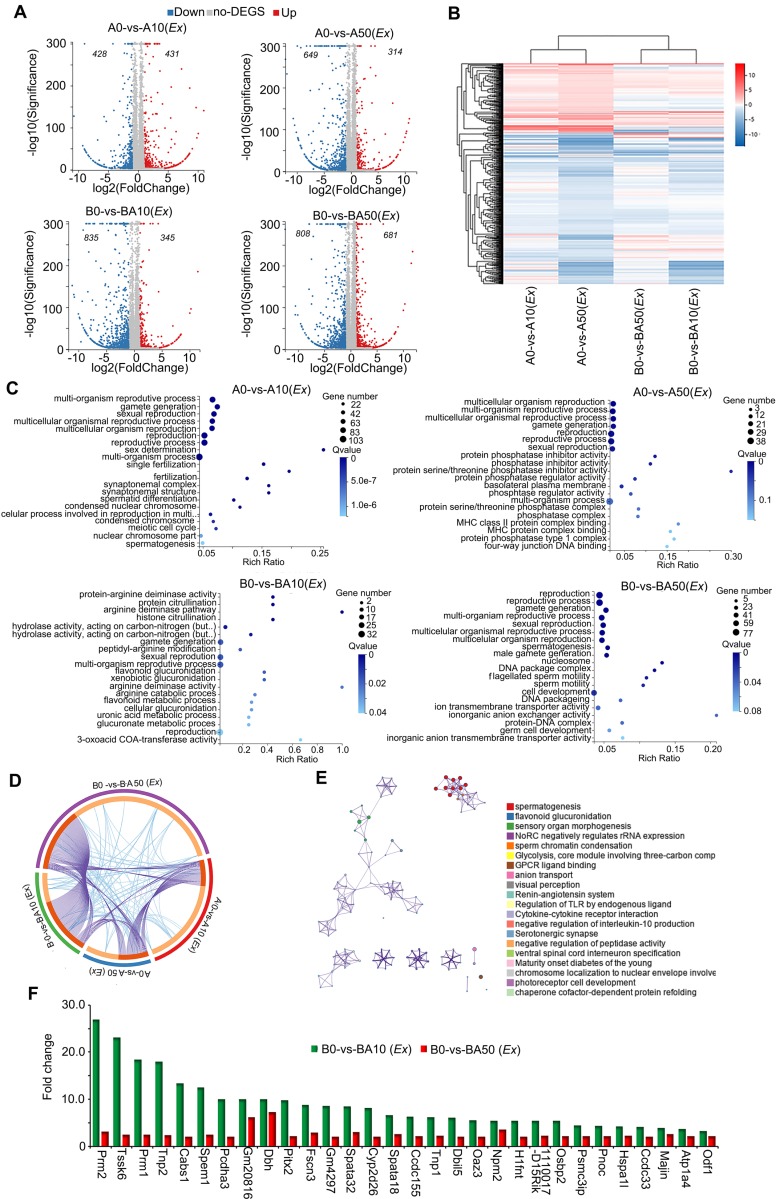
RNA-seq data for ex vivo experiments. (A) Volcano map summary of RNA-seq data in ex vivo experiments. The four comparisons: AOS 0 vs. AOS 10 (ex vivo); AOS 0 vs. AOS 50 (ex vivo); B+A 0 vs. B+A 10 (ex vivo); and B+A 0 vs. B+A 50 (ex vivo). (B) Heatmap summary of the differentially expressed genes in the four comparisons in the ex vivo experiment. (C) GO enrichment of up-regulated genes in the four comparisons in the ex vivo experiment. (D) Circos plots showing interactions between the four comparisons in multiple enrichment analysis in the ex vivo experiment. (E) Enrichment network of shared marker genes in the comparisons in the ex vivo experiment. Each term is indicated by a circular node that is colored according to comparison; nodes that share the same cluster ID are typically close to each other. (F) Gene expression comparison of RNA-seq data in the ex vivo experiments and the 10x scRNA-seq data in the in vivo experiments.

