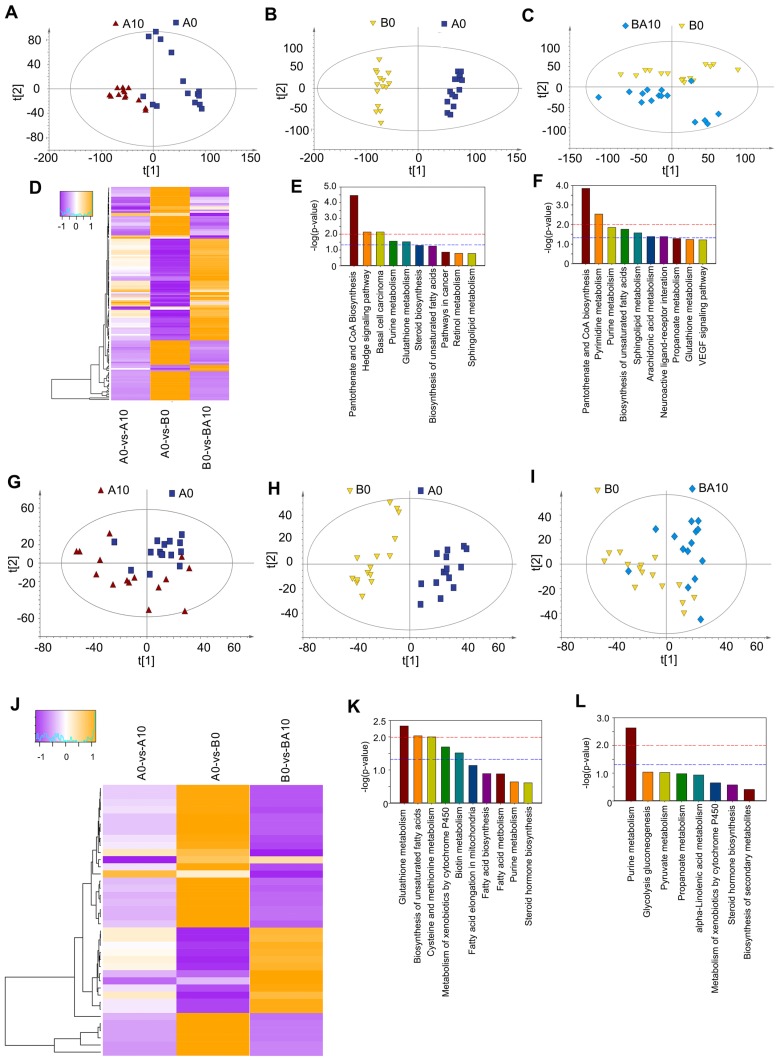
Figure 5.
Plasma and testis metabolome changes. (A) PCA of mouse testis metabolites in the AOS 0 and AOS 10 groups. (B) PCA of mouse testis metabolites in the AOS 0 and B+A 0 groups. (C) PCA of mouse testis metabolites in the B+A 0 and B+A 10 groups. (D) Heatmap of changed testis metabolites. (E) Enriched pathways of changed testis metabolites in AOS 0 vs. AOS 10. (F) Enriched pathways of changed testis metabolites in B+A 0 vs. B+A 10. (G) PCA of mouse plasma metabolites in the AOS 0 and AOS 10 groups. (H) PCA of mouse plasma metabolites in the AOS 0 and B+A 0 groups. (I) PCA of mouse plasma metabolites in the B+A 0 and B+A 10 groups. (J) Heatmap of changed plasma metabolites. (K) Enriched pathways of changed plasma metabolites in AOS 0 vs. AOS 10. (L) Enriched pathways of changed plasma metabolites in B+A 0 vs. B+A 10.

