Figure 6.
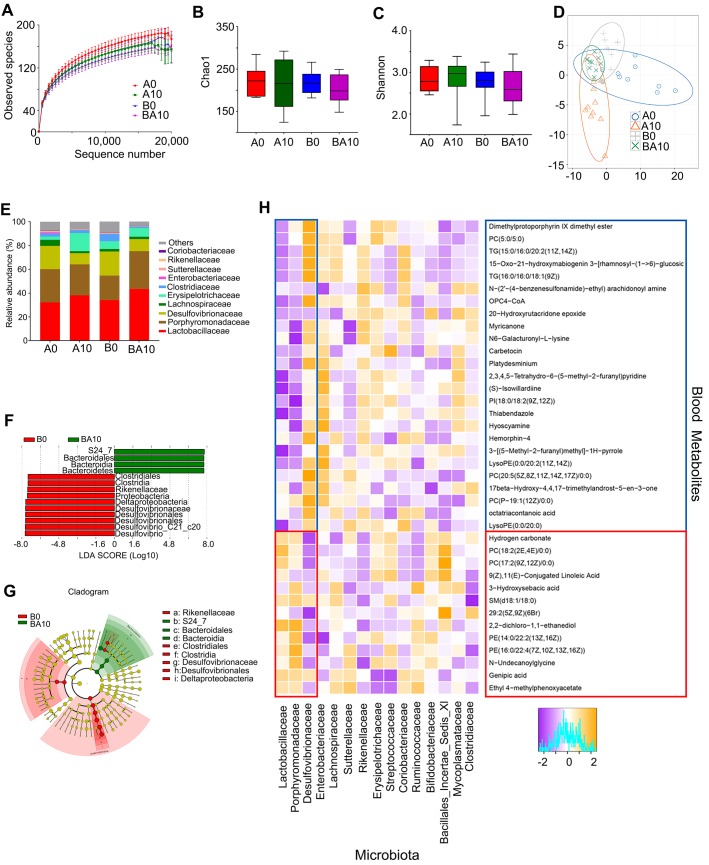
Small intestinal microbiota changes and correlation of changed intestinal microbiota and changed plasma metabolites. The alpha index of the small intestine microbiota: (A) Rarefaction curve; (B) Chao1 index; (C) Shannon index. (D) The PLS-DA of the microflora in different treatments. (E) Differences of bacterial abundance at the family level. (F) LDA distribution. (G) Cladogram. Linear discriminate analysis effect size (LEfSe) was performed to determine the difference in abundance; the threshold of LDA score was 4.0. (n = 10 samples/group)

