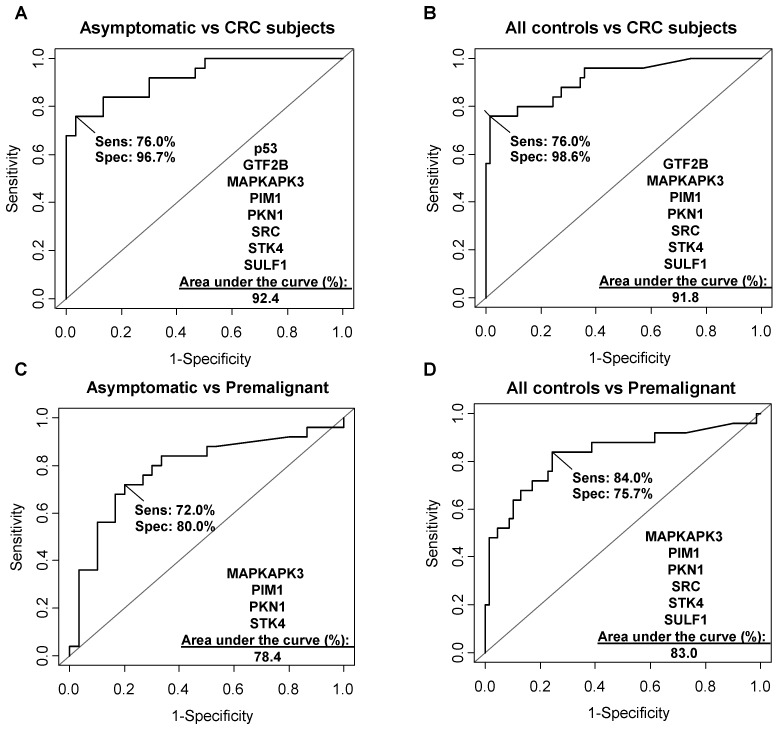
Figure 4.
Diagnostic potential of the simultaneous detection of the TAAs. The diagnostic potential was analyzed by ROC curves comparing the asymptomatic vs CRC group (A), all controls vs CRC subjects (B), asymptomatic individuals vs premalignant subjects (C), and all controls vs the premalignant group (D). All controls: asymptomatic individuals, and breast and lung cancer patients.

