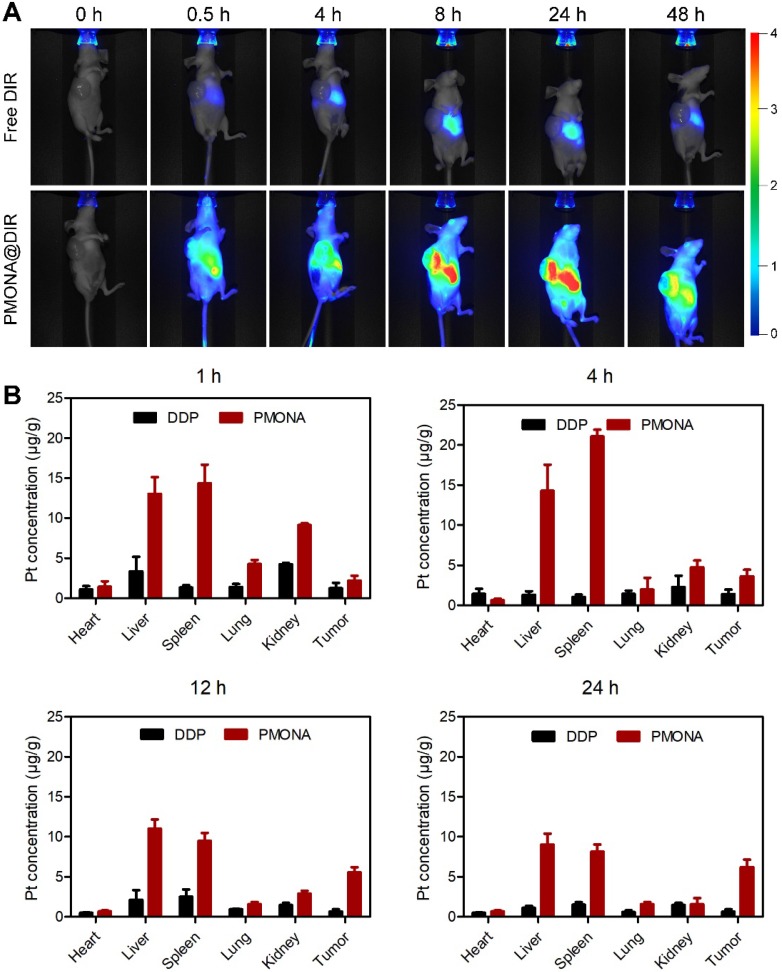
Figure 7.
In vivo distribution of PMONA. (A) Living images of A549 tumor-bearing mice i.v. administrated with free DIR and PMONA@DIR at different time intervals. (B) Pt biodistribution in tissues of A549 xenograft tumor-bearing mice at 1, 4, 12 and 24 h after intravenous injection of free DDP and PMONA.

