Figure 2.
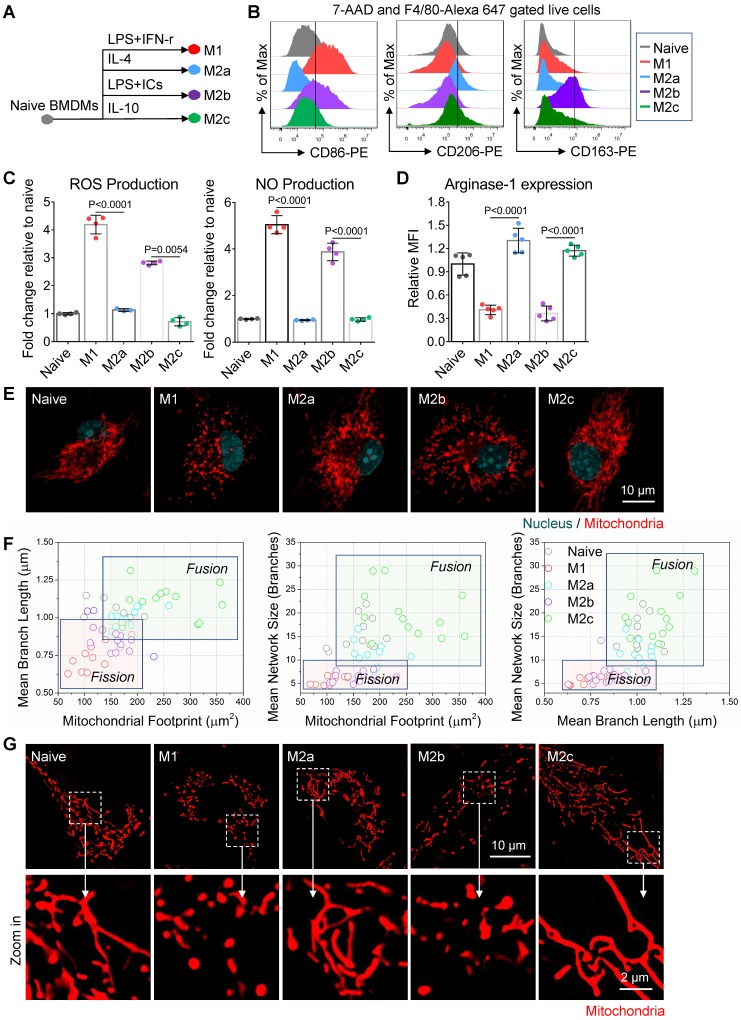
Mitochondria organization correlates with the activation status of BMDMs in vitro. (A) Schematic diagram showing the activation of bone marrow-derived macrophages (BMDMs) using different cytokines. Naive BMDMs were represented by gray color, M1 by red color, M2a by blue color, M2b by violet color, and M2c by green color. (B) After 24 hr of cytokine treatment, a flow cytometer was used to assess CD86, CD206, CD163 expression of BMDMs (naive, M1, M2a, M2b, and M2c). (C) After 24 hr of cytokine treatment, reactive oxygen species (ROS) and nitric oxide (NO) production of BMDMs were measured using DCFH-DA and DAF-FM DA fluorescent probes, respectively. (D) Flow cytometer was used to assess the intracellular arginase-1 expression of BMDMs. Fold changes of expression relative to naive were evaluated by mean fluorescence intensity (MFI). (E) Fluorescence confocal images of mitochondria (red color, MitoTracker Red CMXRos), and nuclei (blue color, Hoechst 33342) in BMDMs. Scale bar, 10 µm. (F) 2D scatter plots from mitochondrial network analysis (footprints, network size, and branch length) performed on BMDMs (naive, M1, M2a, M2b, and M2c). The quadrants of fission/fusion were added to enclose clustered macrophages in feature space based on their mitochondrial organization. The coordinates of each dot represent the feature values of individual cells (n≥10). (G) Representative structured illumination microscopy (SIM) images of mitochondria (red color, MitoTracker Red CMXRos) in BMDMs. Scale bar, 10 µm. All data shown were representative of two or three independent runs of experiments.

