Figure 3.
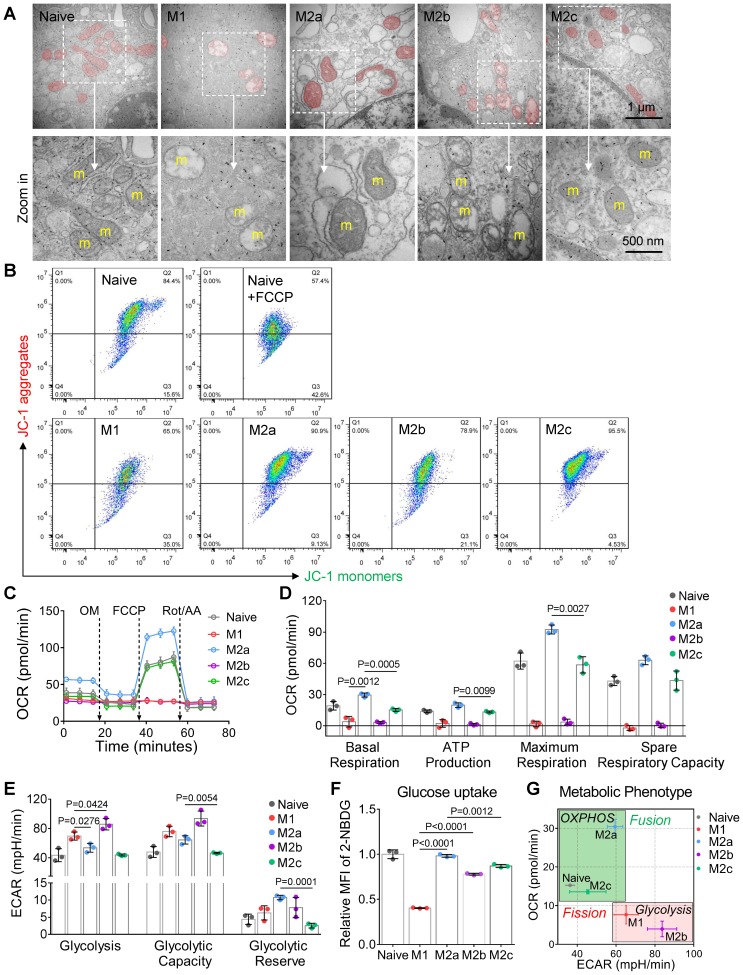
Mitochondria regulate the cellular respiration of activated BMDMs in vitro. (A) Representive transmission electron microscopy (TEM) images of mitochondria in BMDMs. Scale bar, 1 µm. (B) Mitochondrial membrane potential (ΔΨm) was measured using JC-1 probes. 100 μM FCCP-treated naive BMDMs as a positive control. A shifted population to lower fluorescence in the JC-1 aggregates channel shows the mitochondrial membrane potential is compromised. (C) The oxygen consumption rate (OCR) of BMDMs at baseline and in response to sequential treatment with oligomycin (OM), FCCP, and rotenone plus antimycin A (Rot/AA). (D) Basal respiration, ATP production, maximum respiration, and spare respiratory capacity of BMDMs at different activation status. (E) Glycolysis, glycolytic capability, and glycolytic reserve of BMDMs at different activation status. (F) Glucose uptake capability of BMDMs was measured using 2-NBDG fluorescent probes. Fold changes of 2-NBDG uptake were evaluated by MFI. (G) The mapping of metabolic phenotype based on the basal OCR and basal ECAR of BMDMs (naive, M1, M2a, M2b, and M2c). All data shown were representative of two or three independent runs of experiments.

