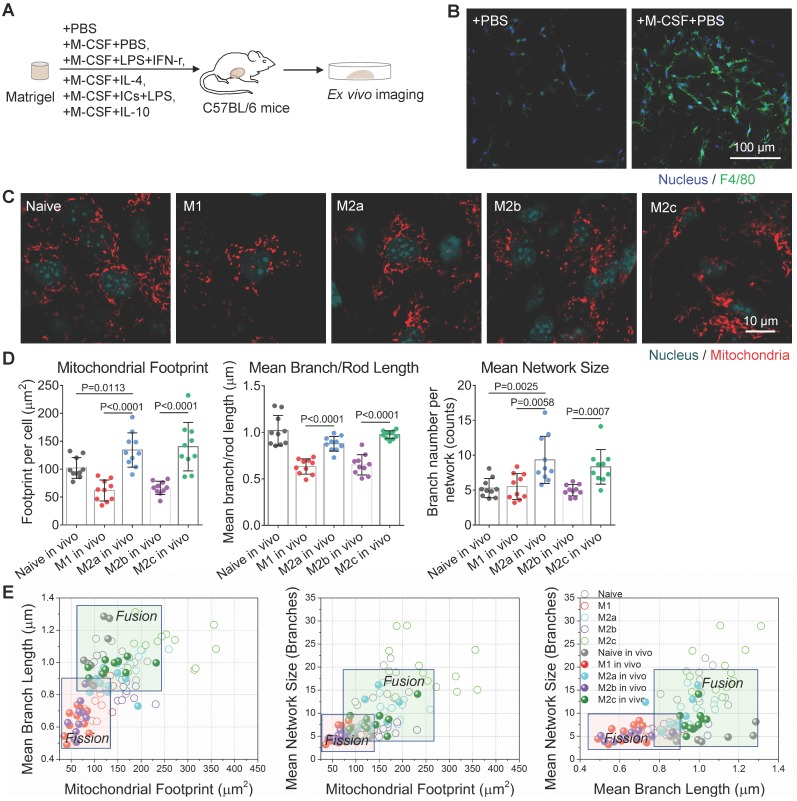
Figure 4.
Mitochondrial dynamics reflects the activation status of Matrigel plug-recruited macrophages in situ. (A) Schematic overview of experiment procedures, including Matrigel mixture preparation, subcutaneous injection and ex vivo imaging on Matrigel plugs. To generated activated macrophages in mice, M-CSF+PBS were used for naive macrophage differentiation, M-CSF+LPS+IFN-γ for M1, M-CSF+IL-4 for M2a, M-CSF+immune-complexes+LPS for M2b, M-CSF+IL-10 for M2c, and PBS only for the control group. (B) Immunofluorescence imaging of F4/80 expression (green) of fixed cells in implanted Matrigel plugs. The nuclei are stained with Hoechst 33342 (blue). Scale bar, 100 µm. (C) Ex vivo live-cell imaging on mitochondria (red color, MitoTracker Red CMXRos), and nuclei (blue color, Hoechst 33342) in different types of macrophages recruited by Matrigel plugs (naive, M1, M2a, M2b, and M2c). Scale bar, 10 µm. (D) Quantitative analysis of mitochondrial organization on macrophages from Matrigel plugs (footprint, network size, and branch length). Dots are data from individual cells (n≥10). (E) Comparison of 2D scatter plots from mitochondrial organization parameters between BMDMs (Naive, M1, M2a, M2b, and M2c) in vitro and macrophages of Matrigel plugs (Naive in vivo, M1 in vivo, M2a in vivo, M2b in vivo, M2c in vivo). The quadrants of fission/fusion were added to enclose clustered macrophages in feature space based on their mitochondrial organization. Dots are data of individual cells (n≥10). All data shown were representative of two or three independent runs of experiments.

