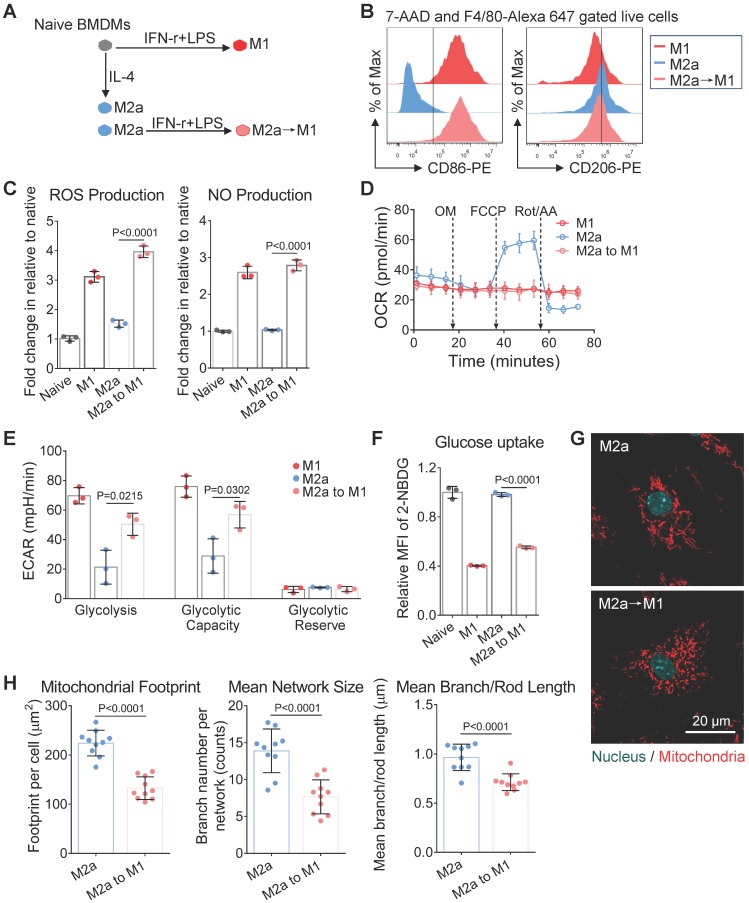
Figure 5.
Mitochondrial morphology changes along with the repolarization of M2a macrophages. (A) Schematic illustration of the M1-activation of anti-inflammatory M2a macrophages. BMDMs were primed with IL-4 for 24 hr to generate M2a macrophages; then cells were treated with IFN-γ plus LPS for an additional 24 hr to generate M2a→M1 macrophages. (B) Flow cytometer data of CD86-PE and CD206-PE expression in M1, M2a, and M2a→M1 macrophages. (C) The ROS and NO production levels in naive, M1, M2a, and M2a→M1macrophages, measured by DCFH-DA and DAF-FM DA fluorescent probes, respectively. (D) Changes of OCR in M1, M2a, and M2a→M1 macrophages with intervention. (E) Changes of glycolysis capability in M1, M2a, and M2a→M1 macrophages with intervention. (F) Glucose uptake capabilities of naive, M1, M2a, and M2a→M1 macrophages were measured by 2-NBDG fluorescent probes. (G) Fluorescence confocal images of mitochondria (red color, MitoTracker Red CMXRos), and nuclei (blue color, Hoechst 33342) in M2a and M2a→M1 macrophages. Scale bar, 20 µm. (H) Changes of the mitochondrial organization during the repolarization of M2a macrophages (M2a, M2a→M1). n=10. All data shown were representative of two or three independent runs of experiments.

