Figure 6.
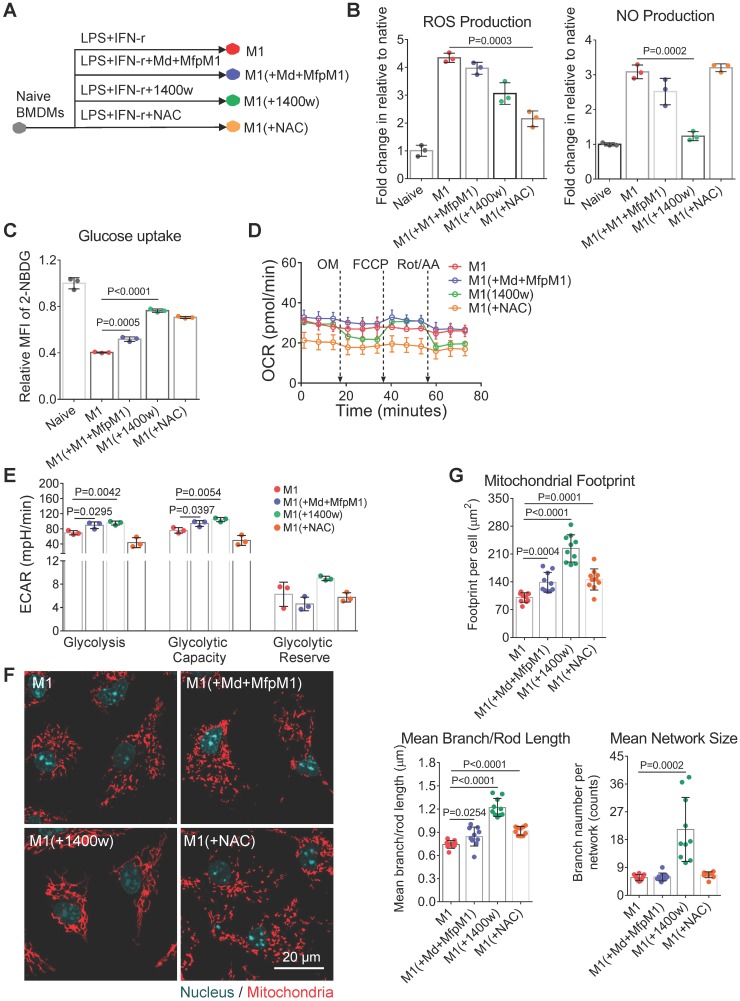
NO blocks the mitochondrial fusion of M1 macrophages. (A) Schematic illustration of the intervention on M1 macrophage activation. The BMDMs were stimulated for 24 hr with IFN-γ plus LPS either in the presence or absence of Mdivi-1 (mitochondrial fission inhibitor) plus MfpM1 (mitochondrial fusion promoter), 1400W (the inhibitor of iNOS), or NAC (N-acetylcysteine, the ROS scavenger). (B) ROS production and NO production of macrophages were measured using DCFH-DA and DAF-FM DA fluorescent probes respectively. (C) Glucose uptake capability of macrophages (M1, M1[+Mdivi-1+MfpM1], M1[+1400w], and M1[+NAC]) were measured using 2-NBDG fluorescent probes. (D) Changes of OCR during M1 polarization with intervention (control, [+Md+MfpM1], [+1400w], and [+NAC]). (E) Changes of glycolytic capability during M1 polarization with intervention (control, [+Md+MfpM1], [+1400w], and [+NAC]). (F) Mitochondrial morphology of macrophages (M1, M1[+Mdivi-1+MfpM1], M1[+1400w], and M1[+NAC]). Mitochondria are red (MitoTracker Red CMXRos), and nuclei are cyan (Hoechst 33342). Scale bar, 20 µm. (G) Changes of mitochondrial organization during M1 polarization with intervention (control, [+Md+MfpM1], [+1400w], and [+NAC]). n=10. All data shown were representative of two or three independent runs of experiments.

