Figure 7.
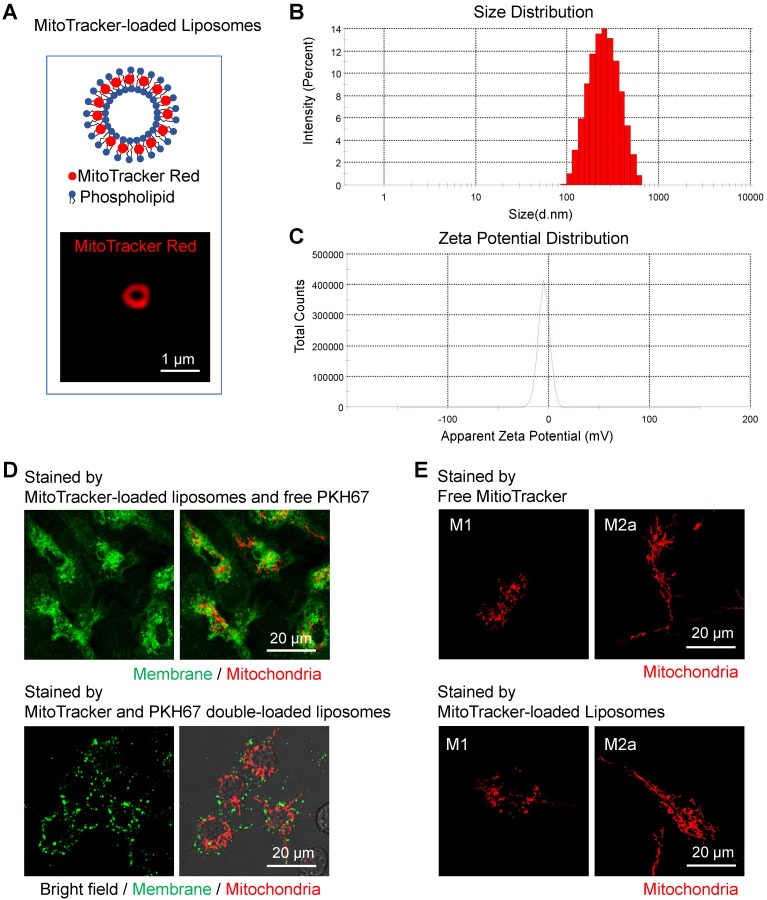
Characterization of MitoTracker-loaded liposomes in vitro. (A) Schematic structure of MitoTracker-loaded liposome and the representative fluorescent image of liposome (red color, MitoTracker Red CMXRos) captured by SIM. Scale bar, 1 µm. (B-C) The distribution of sizes and surface zeta potentials of MitoTracker-loaded liposomes diluted by water. (D) The fluorescence confocal images of labeled membrane and mitochondria in naive BMDMs from C57BL/6 mice. Two ways of labeling, MitoTracker-loaded liposomes subsequently with free PKH67 dye (upper panel) and MitoTracker\PKH67 double-loaded liposomes simultaneously (lower panel), were compared. Cell morphology (gray, bright field), mitochondria (red color, MitoTracker Red CMXRos) and membrane structures (green color, PKH67 Green). Scale bar, 20 µm. (E) The fluorescence confocal images of labeled mitochondria in BMDMs (M1 and M2a activation) from C57BL/6 mice. Two ways of labeling, free MitoTracker, and MitoTracker-loaded liposomes, were compared. Mitochondria (red color, MitoTracker Red CMXRos). Scale bar, 20 µm. All data shown were representative of two or three independent runs of experiments.

