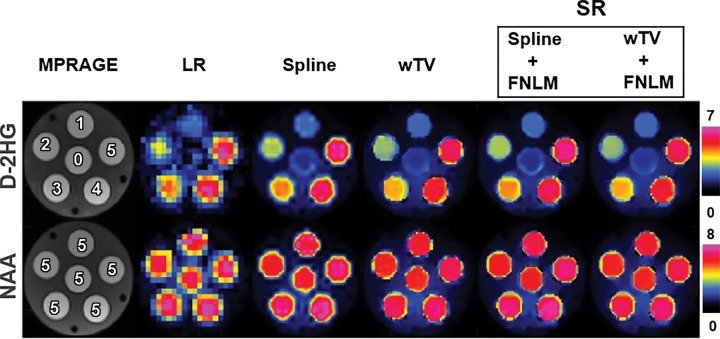
Figure 2:
Upsampled D-2-hydroxyglutarate (D-2HG) and total N-acetylaspartate (NAA) maps of the phantom. From left to right, images were obtained with high-spatial-resolution T1-weighted MRI magnetization-prepared rapid gradient-echo (MPRAGE) (matrix, 138 × 138), low-resolution (LR) total MR spectroscopy (matrix, 46 × 46), upsampled MR spectroscopy with spline interpolation (Spline), upsampled MR spectroscopy with weighted total variation (wTV), super-resolution (SR) MR spectroscopy with spline interpolation and the feature-based nonlocal means method (Spline + FNLM) or SR MR spectroscopy with weighted total variation and FNLM (wTV + FNLM). The numbers on MPRAGE images indicate D-2HG and NAA concentrations in each compartment.

