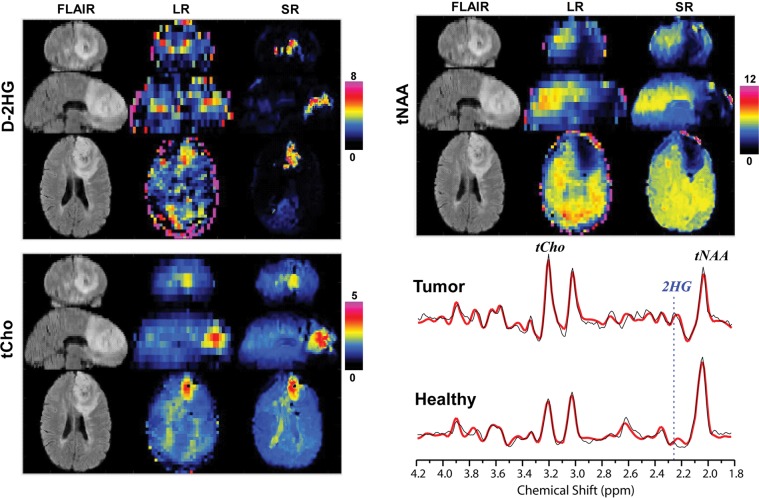
Figure 3:
Examples of upsampled D-2-hydroxyglutarate (D-2HG), total choline (tCho), and total N-acetylaspartate (tNAA) metabolic maps in a participant with isocitrate dehydrogenase–mutated glioma. Images are high-resolution anatomic T2-fluid-attenuated inversion-recovery (FLAIR) MRI scans and low-resolution (LR) (matrix, 46 × 46 × 10) and super-resolution (SR) (matrix, 138 × 138 × 40) maps. In each group, top, middle, and bottom images are coronal, sagittal, and axial views. The bottom right image shows spectra from tumor voxels, with the position of the 2.25-ppm peak of D-2HG indicated by the dotted line.

