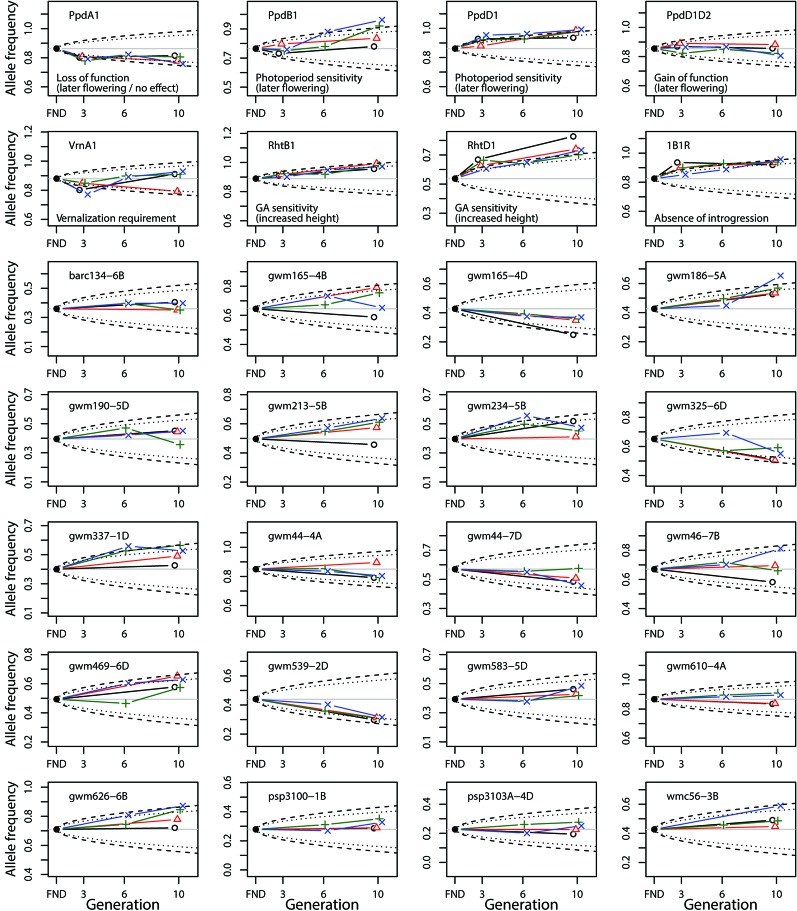
Figure 3.
Change of allele frequency in the composite cross populations (CCP) starting from the estimated allele frequency of the virtual founding population (FND). The allele frequency is shown for the frequent allele in the FND population. The different colors denote the allele frequencies in the populations at the different locations (black: MET, red: MOR, green: SOF, blue: WAF). The dashed and dotted lines indicate the 95% CI of the allele frequency expected under pure genetic drift given an Ne = 150 and Ne = 250, respectively. For the SNP marker loci (top two rows), the function of the frequent allele is given.

