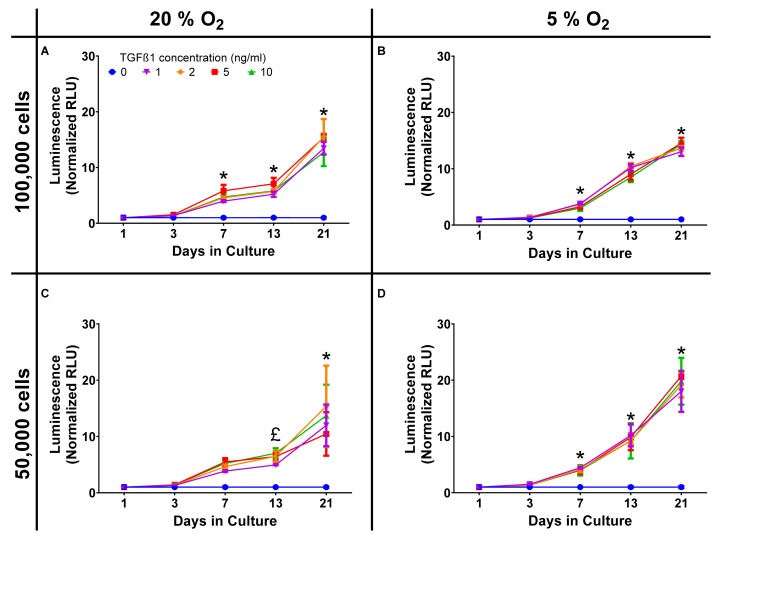
FIGURE 1.
Oxygen and cell density response. Dose response curves, normalized to the control of 0 ng/ml TGFβ1 in chondrogenic media, were constructed and show a time dependent increase in luminescence but with similar responses in terms of both cell number and oxygen tension. (A) 20% O2, 100,000 cells; (B) 5% O2, 100,000 cells; (C) 20% O2, 50,000 cells; (D) 5% O2, 50,000 cells. * = all concentrations significantly greater than basal media, £ = concentrations ≥ 2 ng/ml TGFβ1 significantly greater than basal media (p < 0.05).

