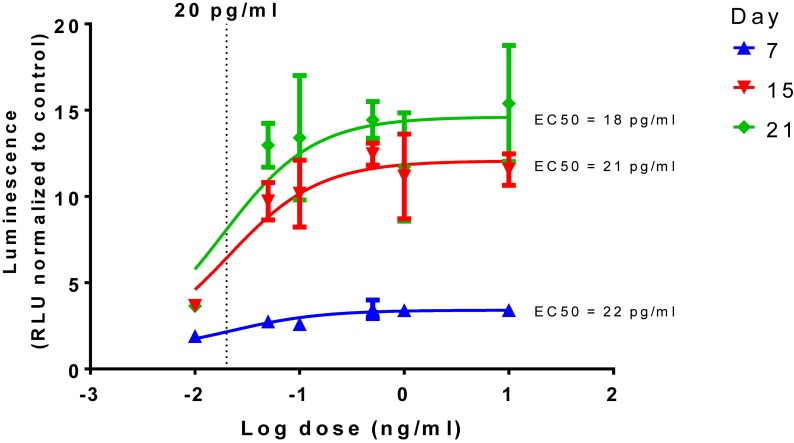
FIGURE 2.
Time and dose dependent effect of TGFβ1 on chondrogenesis. Dose response curves, normalized to the control of 0 ng/mL in chondrogenic media, were constructed and show a time dependent increase in luminescence but with similar EC50s, a dotted line is shown to show 20 pg/mL in the log scale.

