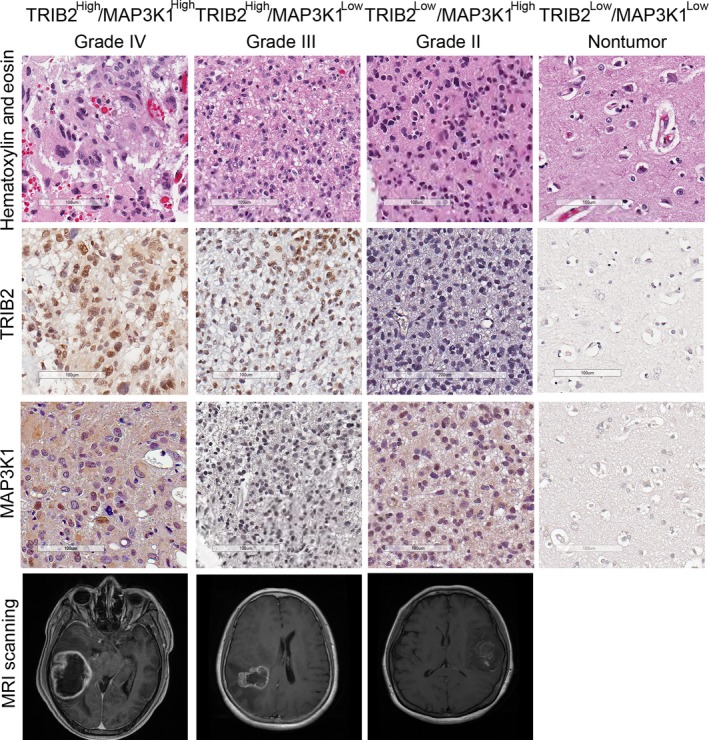
Figure 5.

Representative IHC images of TRIB2 and MAP3K1 in glioma samples. Upper panel: H&E staining; second panel: TRIB2 staining; third panel: MAP3K1 staining; lower panel: presurgical dynamic contrast‐enhanced scanning. Brain tissue from epilepsy surgery was used as a negative control
