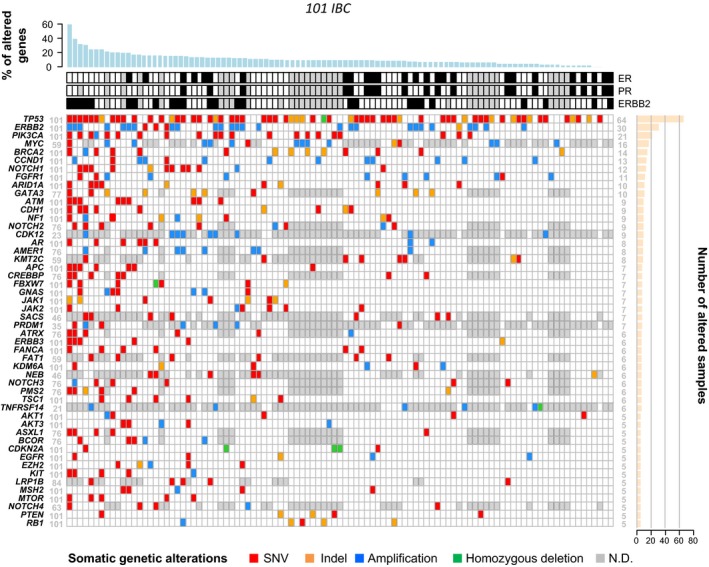
Figure 1.

Distribution of alterations of the top 50 genes altered in IBC. Oncoprint of the top 50 genes altered in at least two IBC samples and analyzed in at least 20 samples. Top: immunohistochemical status for ER, PR, and ERBB2 (white: negative; black: positive; gray: unavailable). Bottom: somatic gene alterations (mutations and CNA) color‐coded according to the legend. The genes are ordered from top to bottom by decreasing number of altered tumors (right panel) and the tumors from left to right by decreasing percentage of altered genes (top panel). ND: not defined.
