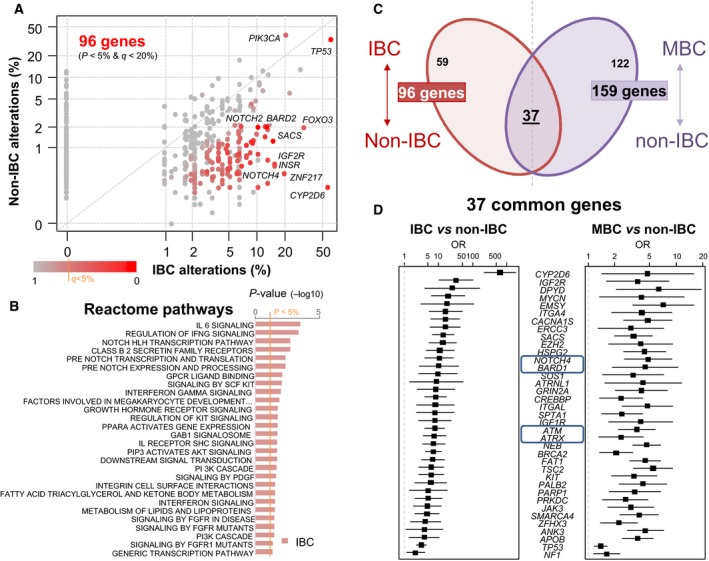
Figure 2.

Identification of genes with differential frequency of alterations between samples. (A) Scatter plot depicting the alteration frequency (% of patients) between IBC and non‐IBC. Each dot represents one gene, and dots are color‐coded according to the P‐values (−log10 P‐values) according to the legend below. Significantly mutated genes in either IBC or non‐IBC are included. A few genes differentially mutated are labeled. (B) Ontology analysis revealed several Reactome pathways significantly associated with the 95 IBC genes. (C) Crossings of the lists of genes differentially altered in IBC vs non‐IBC (96 genes) and of genes differentially altered in metastatic (MBC) vs primary non‐IBC (159 genes). (D) List of 37 genes common to the two gene lists. OR: odds ratio of frequencies of alterations in the tumor subgroups.
