
Figure 3.
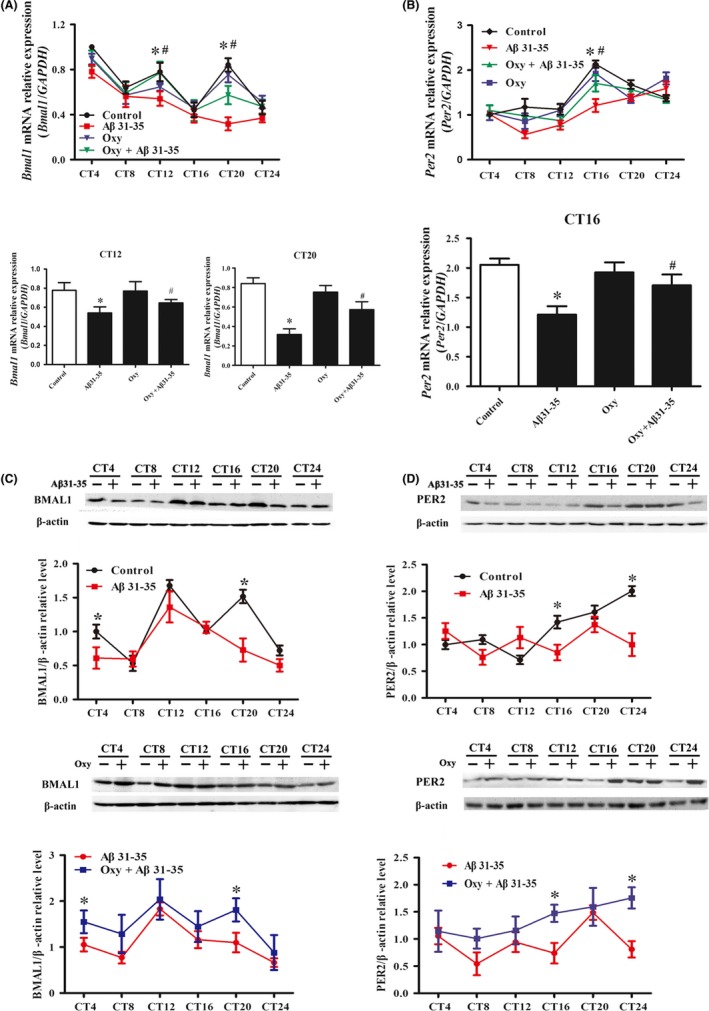
The impact of Oxy on Aβ31‐35‐induced abnormal expression of Bmal1 and Per2 in hippocampal HT22 cells. A, B, Real‐time PCR was used to measure Bmal1 and Per2 mRNA expression in HT22 cells. C, D, Western blotting analysis showing the protein expression of BMAL1 and PER2. Data were expressed as the mean ± SEM (n = 6 per group). *P < .05 compared to the control group; # P < .05 compared to the Aβ31‐35 group