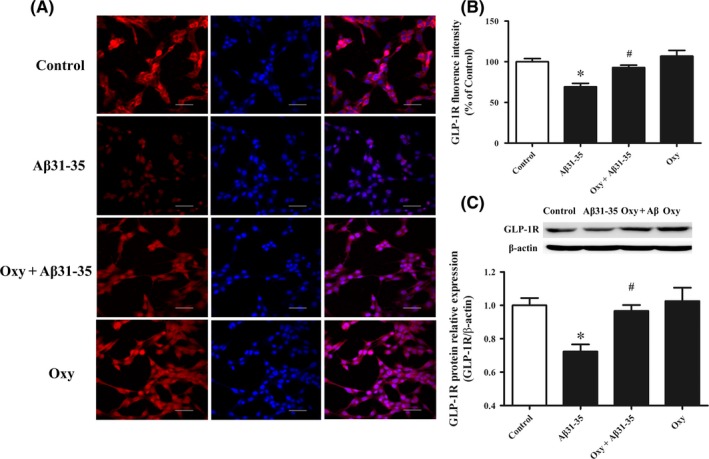
Figure 4.

The role of Oxy on Aβ31‐35‐induced decrease in GLP‐1R expression. A, Representative images of immunofluorescence staining for GLP‐1R (red) and DAPI (blue) in HT22 cells. Scale bar: 50 μm. B, Statistical analysis of the fluorescence intensity of GLP‐1R. C, Western blot analysis of GLP‐1R in HT22 cells. Data were expressed as the mean ± SEM (n = 6 per group). *P < .05 compared to the control group; # P < .05 compared to the Aβ31‐35 group
