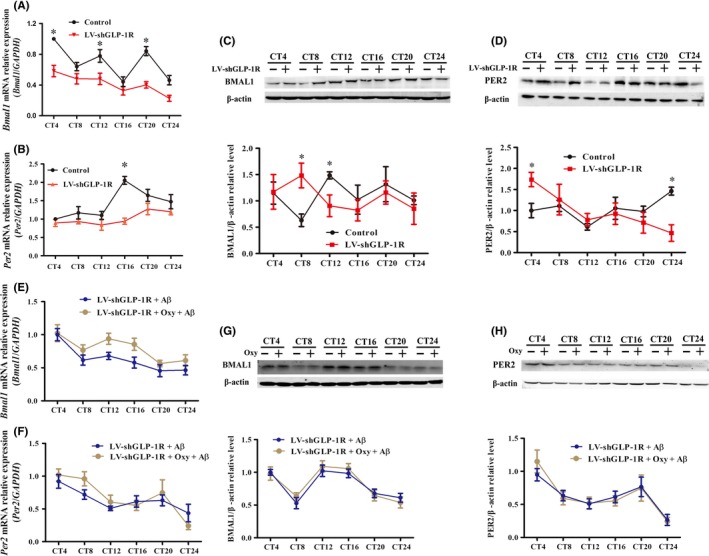
Figure 6.

The effect of GLP‐1R interference on Oxy‐improved abnormal expression of Bmal1 and per2 in hippocampal HT22 cells using a lentivirus. A, B, Real‐time PCR was used to measure Bmal1 and per2 mRNA expression at indicated circadian times in the control and LV‐shGLP‐1R groups (n = 6 per group). C, D, Western blot analysis of BMAL1 expression and PER2 expression in HT22 cells (n = 8 per group). E, F, mRNA levels of Bmal1 and Per2 were assessed at the indicated circadian times in the LV‐shGLP‐1R + Aβ31‐35 and the LV‐shGLP‐1R + Oxy + Aβ31‐35 groups (n = 9 per group). G, H, Western blot analysis of BMAL1 and PER2 at the indicated circadian times in the two groups (n = 9 per group). Data were expressed as the mean ± SEM. *P < .05 compared to the control group
