
Figure 2.
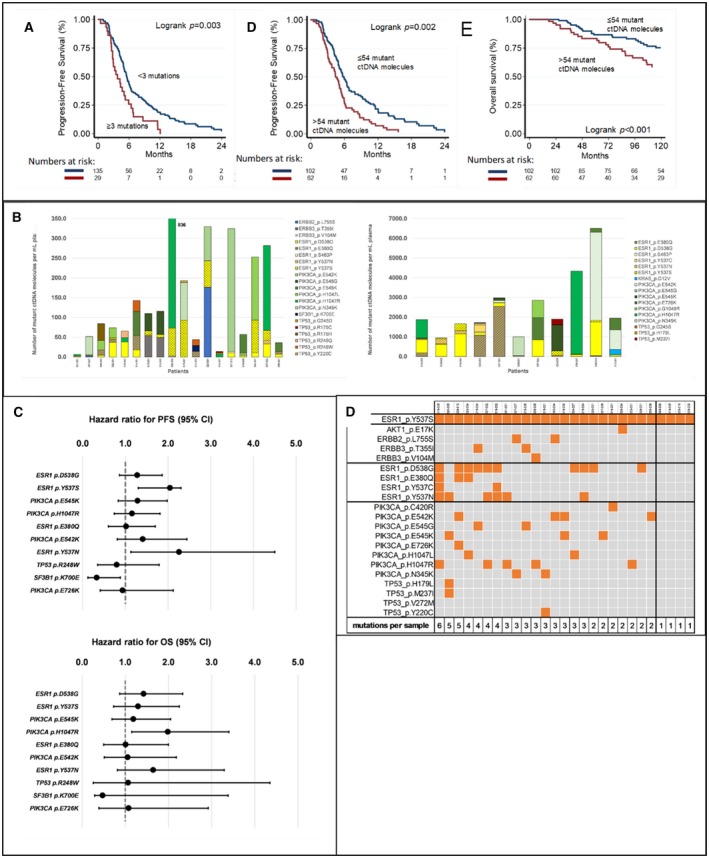
ctDNA characteristics and survival. (A) The ctDNA load and number of mutations and their relation with PFS on EVE/EXE and with OS. (B) Samples (n = 29) with ctDNA containing ≥ 3 mutations showing heterogeneity in mutant ctDNA molecules per patient. It represents the sum of mutant ctDNA molecules per mL plasma for all gene mutations found in 29 patients with ≥ 3 hotspot mutations in their ctDNA. The figure shows the patients who have < 1000 (left, N = 18) or more than 1000 (right, N = 11) mutant ctDNA molecules per mL plasma. Some patients exhibit clearly large differences in the number of mutant ctDNA molecules among mutations. (C) Top 10 most frequent gene hotspot mutations observed in this study and relationship with PFS and OS. (D) Patients with ESR1 p.Y537S mutations (n = 27) have no other mutation (n = 4), additional mutations in ESR1 (n = 12), or mutations in other genes (n = 11).