
Figure 1.
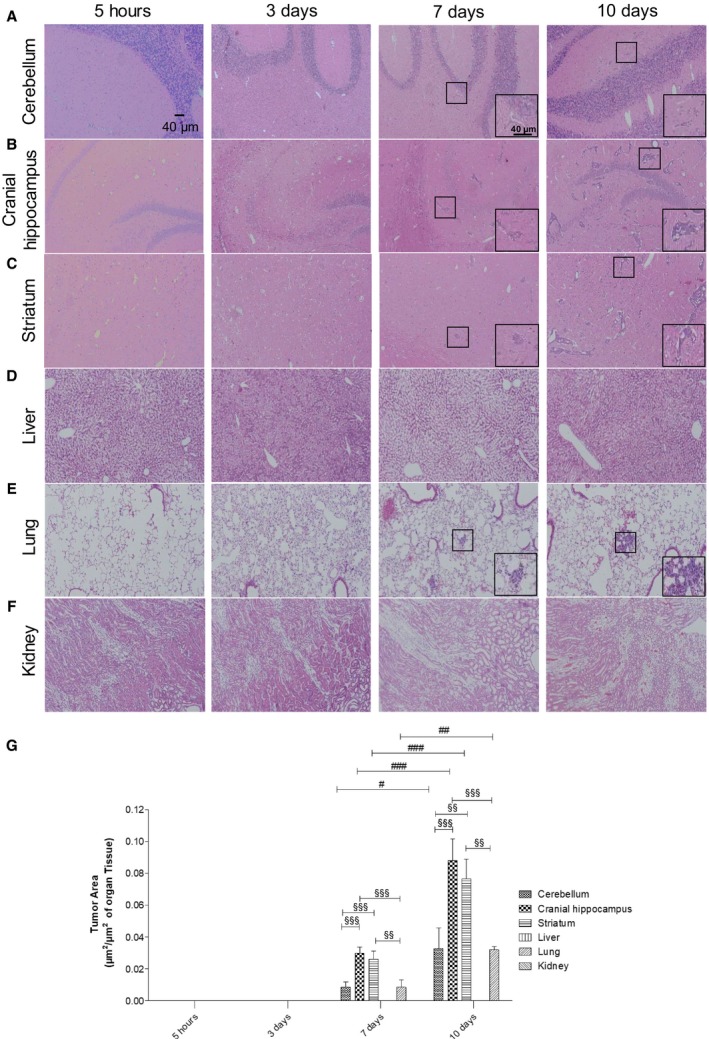
Profile of breast cancer metastases in the brain and peripheral organs. Hematoxylin–eosin staining of cerebellum (A), cranial hippocampus (B), striatum (C), liver (D), lung (E), and kidney (F) was performed, and the tumor area was quantified (G) at several timepoints after inoculation of triple‐negative breast cancer cells in 7‐ to 8‐week‐old female Balb/c mice (n = 6). Insets show the magnification of the selected representative metastasis (inside the squares). The results are expressed as mean ± SEM. A one‐way ANOVA, followed by the Bonferroni post hoc test, was used to evaluate the significant changes in parameters, between the different timepoints and studied organs. # P < 0.05, ## P < 0.01, and ### P < 0.001 between indicated timepoints, for the same regions; §§ P < 0.01 and §§§ P < 0.001 between indicated regions for the same timepoint.