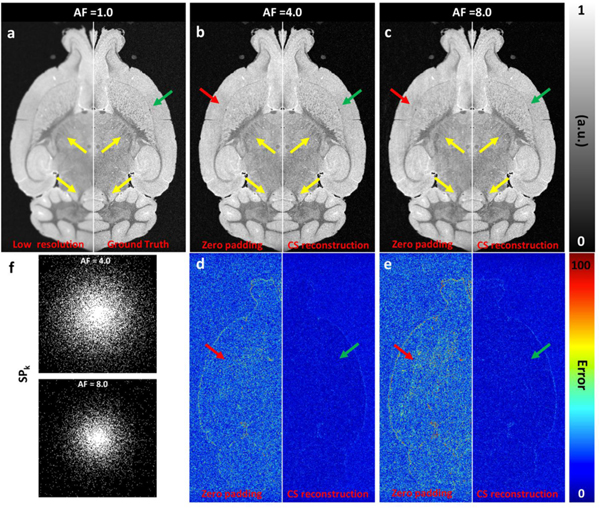
Figure 1:
The simulation results with CS of a) 1.0; b) 4.0; c) 8.0. The coherence was measured by the point spread function (PSF). CS reconstruction was significantly affected by the sampling pattern (a-e). The fully sampled data was retrospectively downsampled to 4.0 and 8.0, and the CS reconstructed images showed limited error (e). The sampling patterns in k-space with AF =4.0 and 8.0 were also shown (f).

