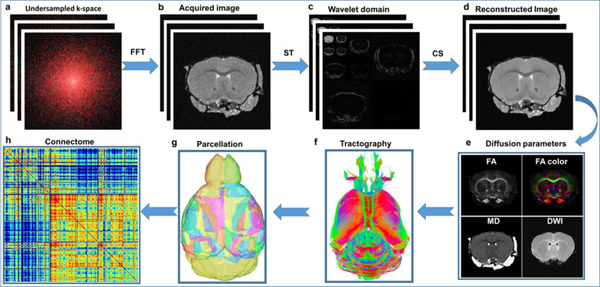
Figure 2:
The CS pipeline from data acquisition to brain connectome. The raw image from under sampled k-space (a) showed incoherent artifacts after direct Fourier transformation (b). The images were much sparser in wavelet domain (c). The images were subsequently reconstructed slice by slice from under sampled data with a nonlinear algorithm (d). The diffusion metrics (FA, MD) were calculated from the reconstructed diffusion images (e). The brain connectome (h) was generated from whole brain tractography (f) and the parcellation of the whole brain (g). FFT: Fast Fourier Transform; ST: Sparsifying Transform; CS: Compressed Sensing; FA: Fractional Anisotropy; MD: Mean Diffusivity

