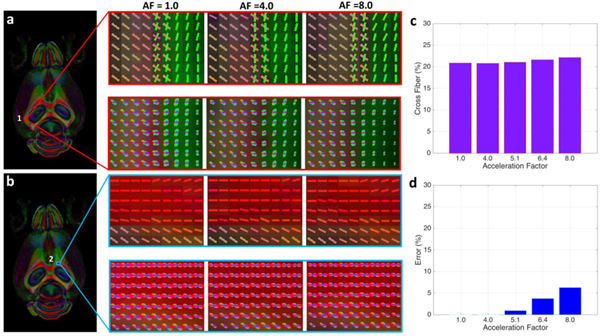
Figure 6:
Two representative ROIs (positioned at 1: lateral aspect of corpus callosum and alveus; 2: rostral aspect corpus callosum) show fiber distributions derived from CS reconstructed data, as well as the fully sampled data. The microstructural organization of white matter tracts in each voxel are visualized using the orientation distribution function (ODF) map reconstructed from the 46-directions diffusion data and the underlying estimated fiber orientations. The crossing fibers were resolved in the fully sampled data (AF = 1.0) at the interface of corpus callosum and alveus (ROI 1), while no cross fibers are shown in the corpus callosum regions (ROI 2). The results at AF = 4.0 agreed well with the fully sampled data with about 1.0% variation, while the difference gradually increased with higher AF. The estimate of the number of crossing fibers in ROI 1 at AF=8.0 differed from the fully sampled data by < 7.0 %.

