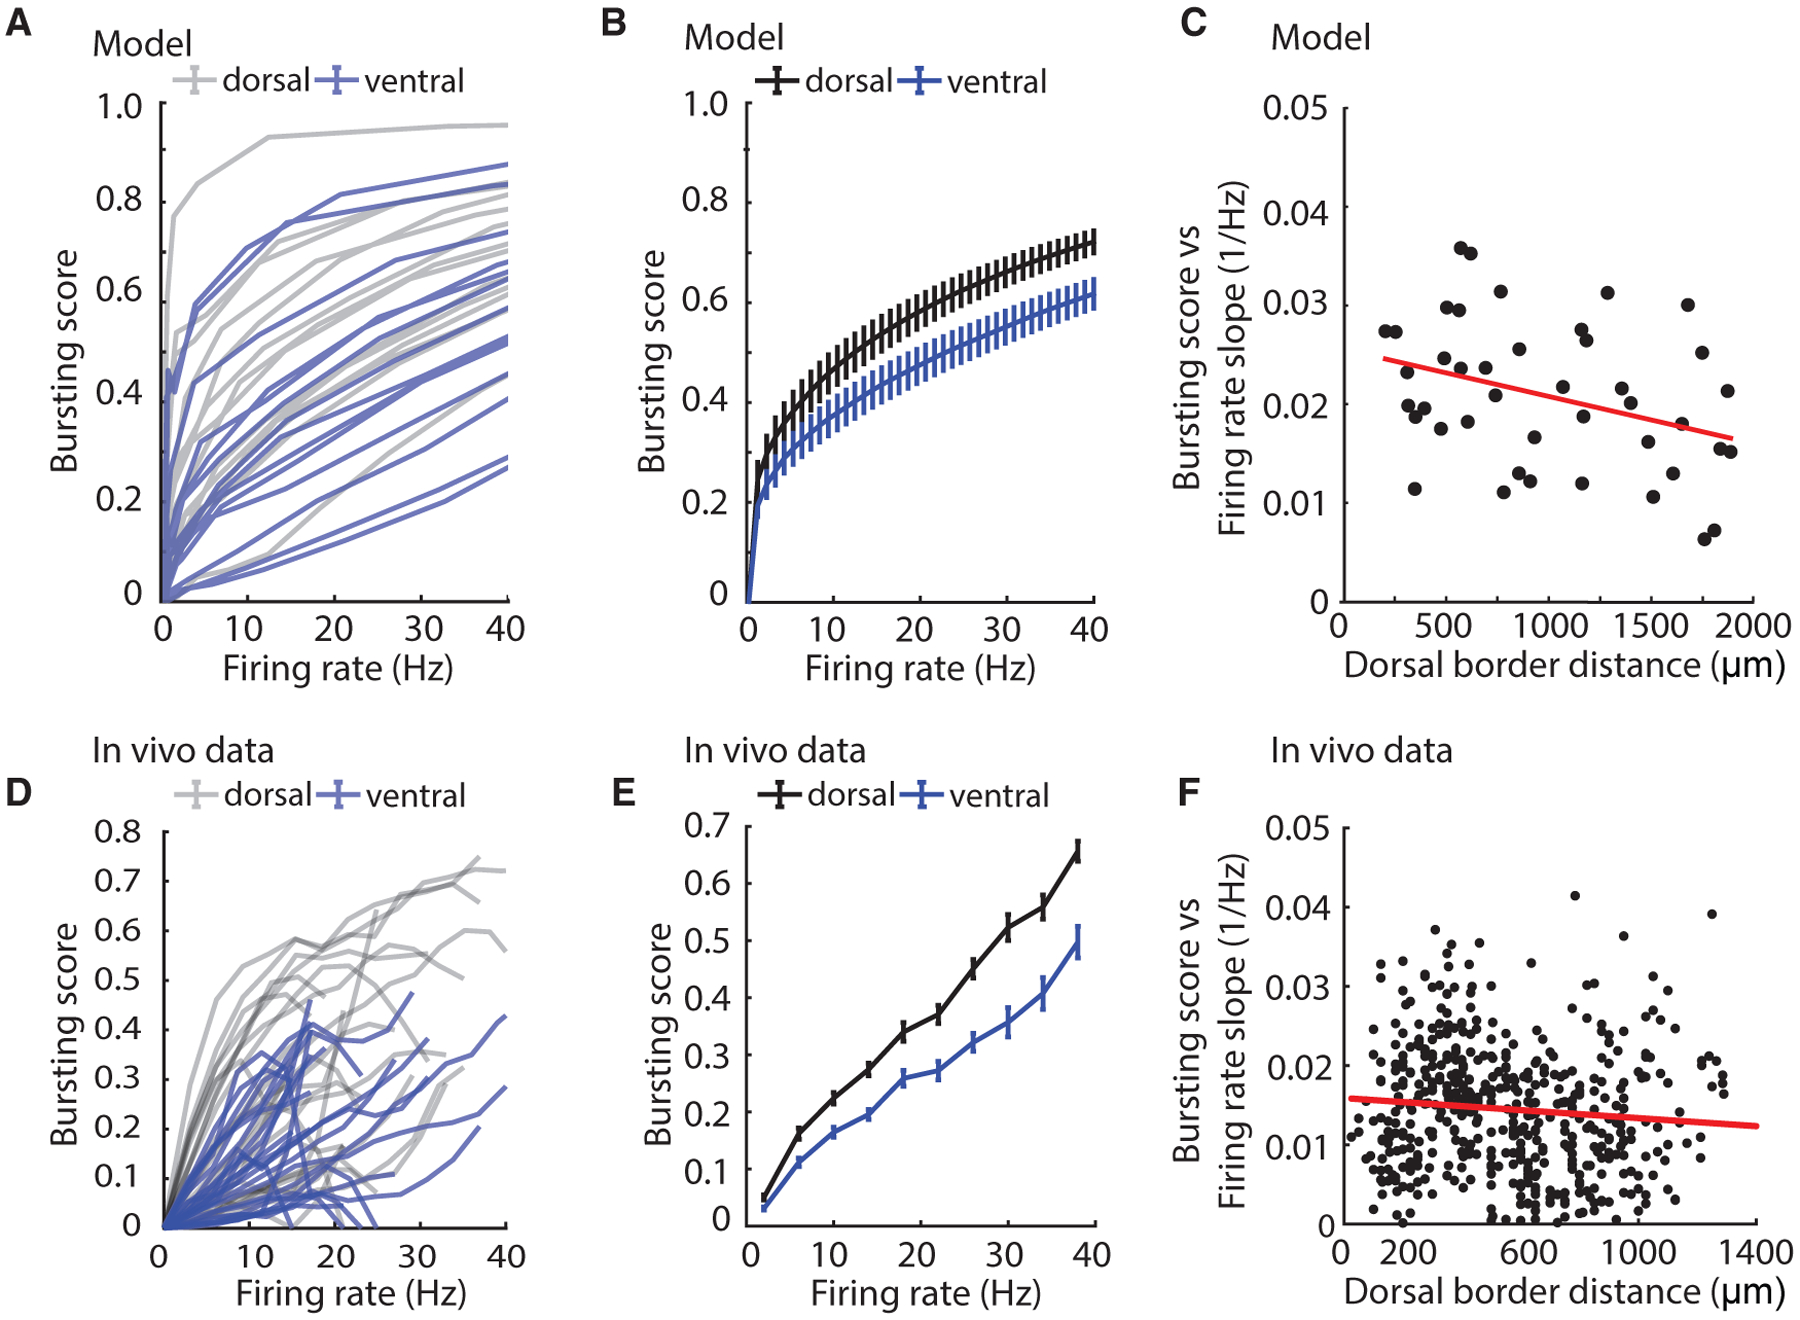
Figure 4. Model Captures In Vivo Bursting Using Measured In Vitro Temporal Dynamics.

(A) Bursting score versus firing for modeled cells on the basis of in vitro SST recordings and slow exponential decay times (simulations based on values from most dorsal third of axis in gray and most ventral third of axis in blue).
(B) Summary data for dorsal and ventral thirds of modeled cells.
(C) Slope of linear fit to all modeled single-cell curves in (A) as a function of dorsal border distance.
(D) Bursting score versus firing rate for a random sample of in vivo cells (gray, most dorsal third; blue, most ventral third of axis).
(E) Summary bursting score versus firing rate tuning curves for dorsal and ventral thirds of all in vivo cells (dorsal, n = 122; ventral, n = 90). Mean ± SEM plotted.
(F) Slope of linear fit to all single-cell curves in (D) as a function of dorsal border distance.
See also Figure S5.
