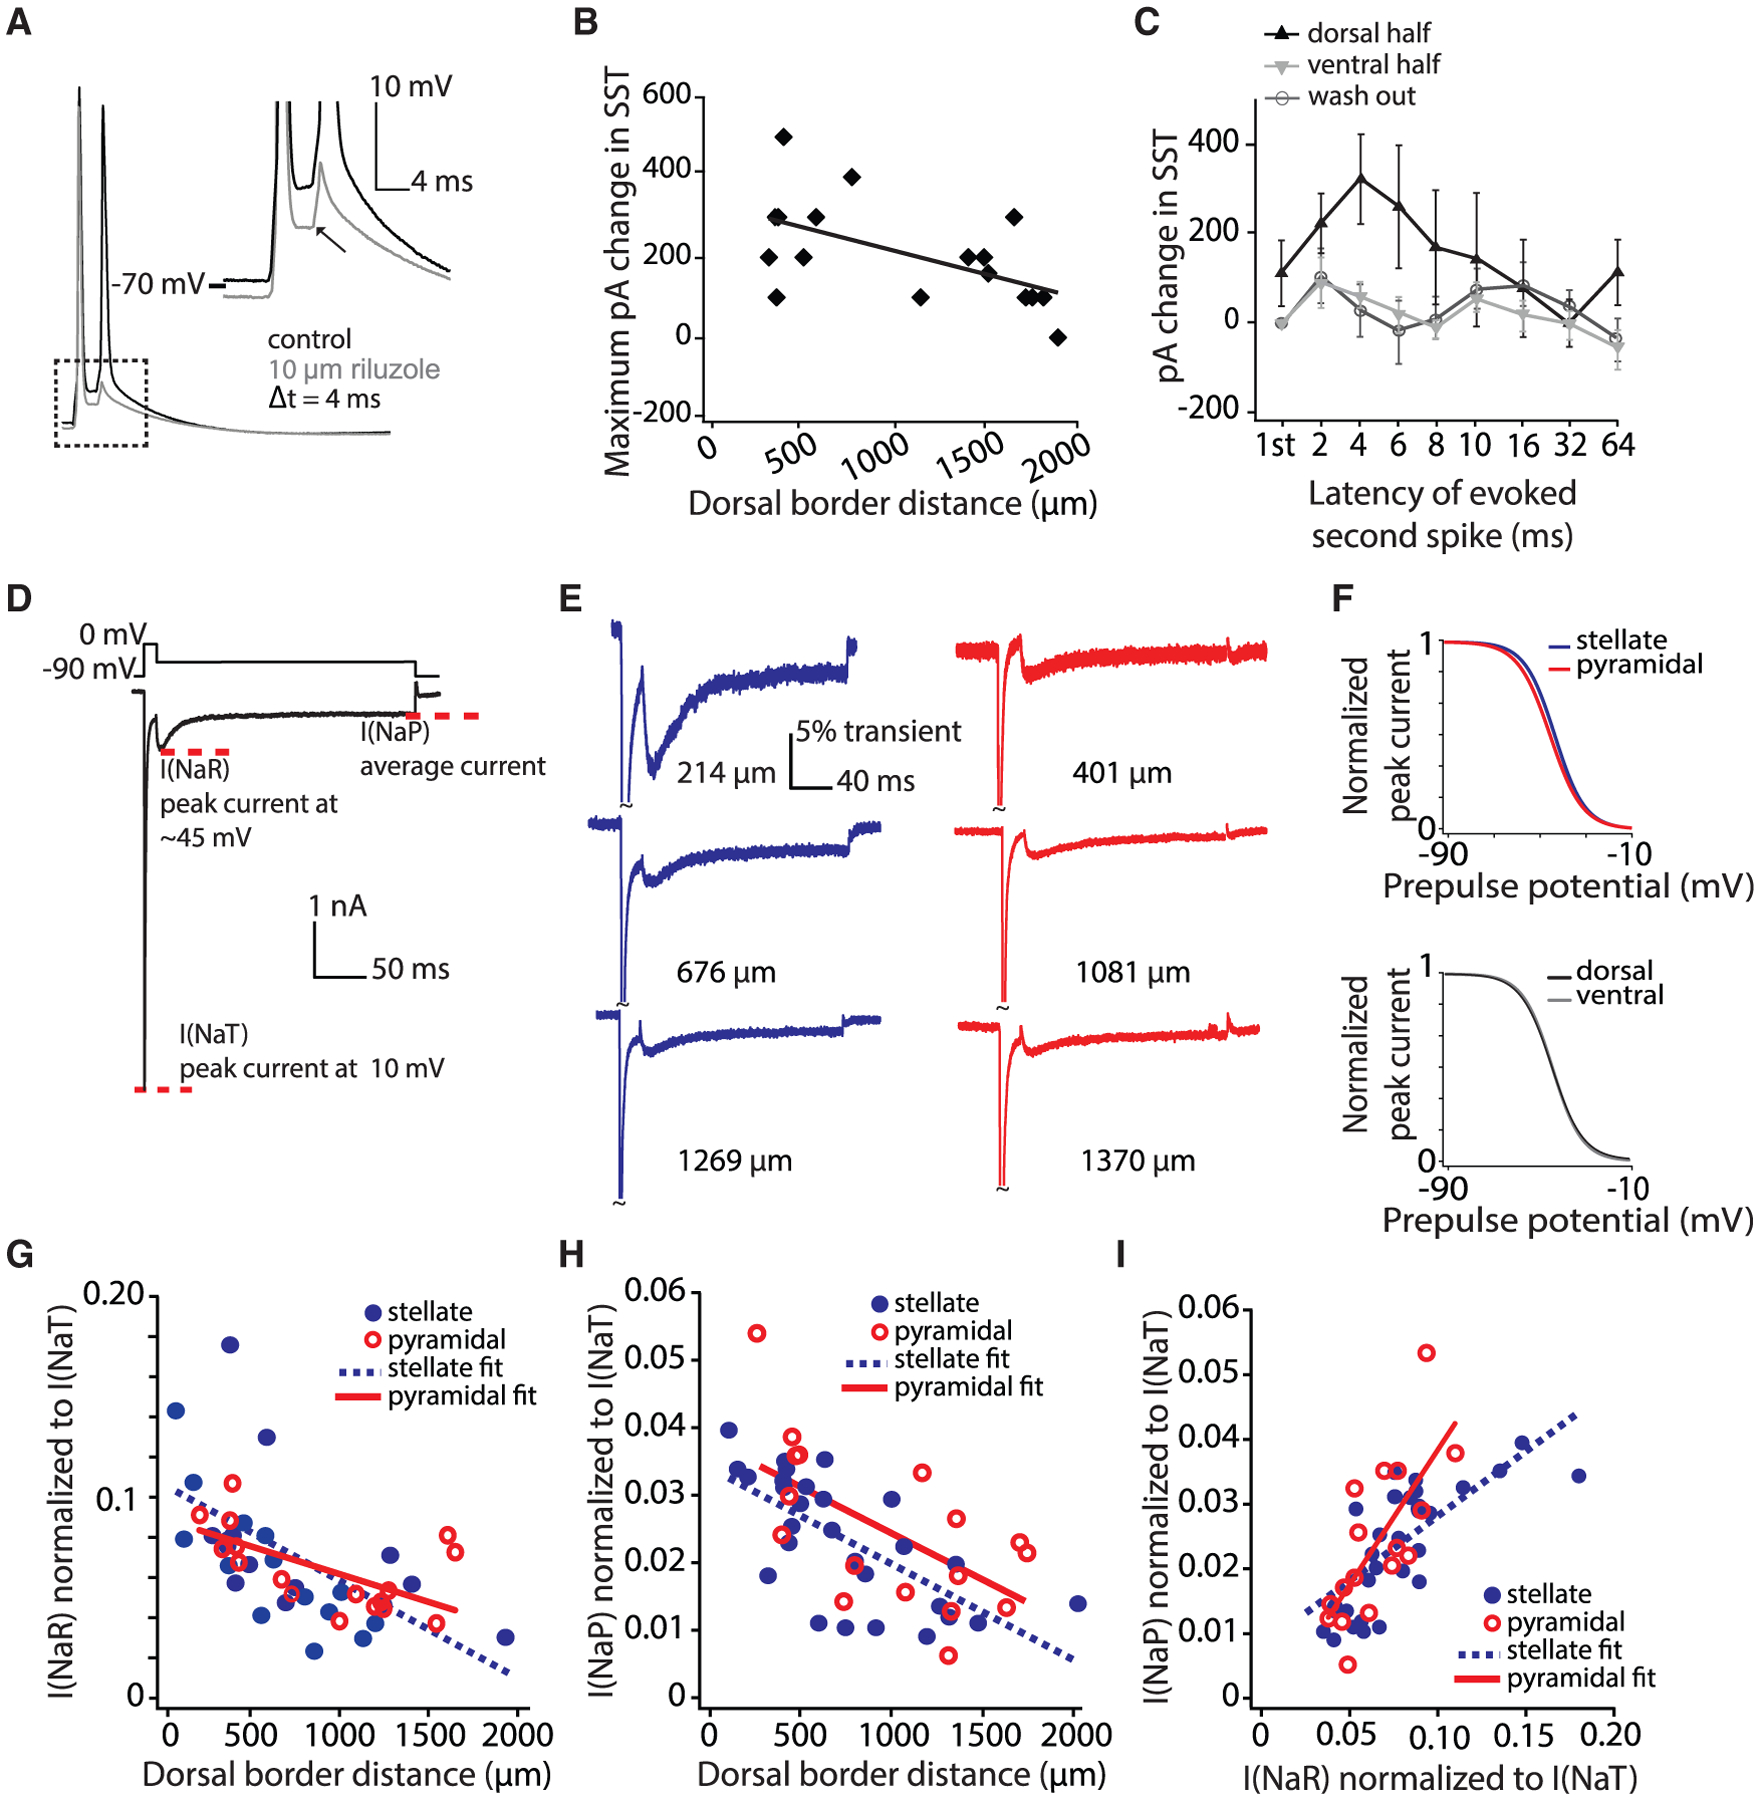
Figure 5. Na Current Components Are Graded along the MEC DV Axis.

(A) A representative SST protocol recording in control (black) and riluzole (gray). Inset depicts the decrease in depolarization following a spike in the presence of riluzole.
(B) Largest change (across all latencies) in the SST value in riluzole as a function of the cell’s position along the DV axis. Current plotted (pA) indicates the additional current required to rescue a second spike at a given latency. Best-fit line to data is shown.
(C) Increase in picoamperes required to rescue control SST values at various latencies (log axis). Mean ± SEM plotted. The DV axis is binned into halves (dorsal, 315–1,139 μm; ventral, 1,140–1,885 μm). Only cells for which data on all eight latencies were obtained were included in this analysis.
(D) Voltage-clamp protocol used to assay Na current components. The transient current is measured as the peak current elicited at 10 mV. I(NaR) is measured as the peak current elicited by any voltage repolarization. I(NaP) is measured as the average of the last 10 ms of the step.
(E) Representative voltage-clamp recordings of stellate (blue) and pyramidal (red) neurons (DV location listed to the right of each trace).
(F) Normalized Boltzman equation-derived steady-state inactivation curves plotted for average values from individual fits. Top shows stellate (blue) versus pyramidal (red) neurons and bottom shows dorsal (black) and ventral (gray) neurons. Four cells with insufficient traces were not included in this analysis. Na gradients did not show significant differences in inactivation parameters between stellate and pyramidal cells (mean ± SEM; V1/2, stellate = −42.7 ± 1.1 mV, pyramidal = −44.7 ± 1.2 mV, t[39] = 1.17, p = 0.25; slope factor (k), stellate = 6.41 ± 0.17 mV, pyramidal = 6.87 ± 0.15 mV, t[39] = −1.46, p = 0.15; Imax, stellate = −5.84 ± 0.33 nA, pyramidal = −4.67 ± 0.33 nA, t[39] = −0.99, p = 0.33). Inactivation parameters also did not differ between dorsal (0–1,000 μm) and ventral (>1,000 μm) cells (mean ± SEM; V1/2, dorsal = −43.4 ± 1.1 mV, ventral = −43.7 ± 1.2 mV, t[39] = 0.13, p = 0.90; slope factor (k), dorsal = 6.45 ± 0.16 mV, ventral = 6.80 ± 0.29 mV, t[39] = −1.14, p = 0.26; Imax, dorsal = −4.92 ± 0.40 nA, ventral = −5.30 ± 0.48 nA, t[39] = 0.61, p = 0.54).
(G) Normalized I(NaP) density in stellate (blue) and pyramidal (red) neurons decreases along the DV axis. Best-fit lines to data are shown.
(H) Same as (F) but for normalized I(NaP). The gradients of Na current component amplitudes did not differ between cell types (ANCOVA, comparison of slopes: I[NaP], F[1, 41] = 0.017, p = 0.90, η2 = 0; I[NaR], F[1, 41] = 1.98, p = 0.17, η2 = 0.05).
(I) Correlation of I(NaR) and I(NaP) within individual neurons. Best-fit lines to data are shown.
See also Figure S5.
