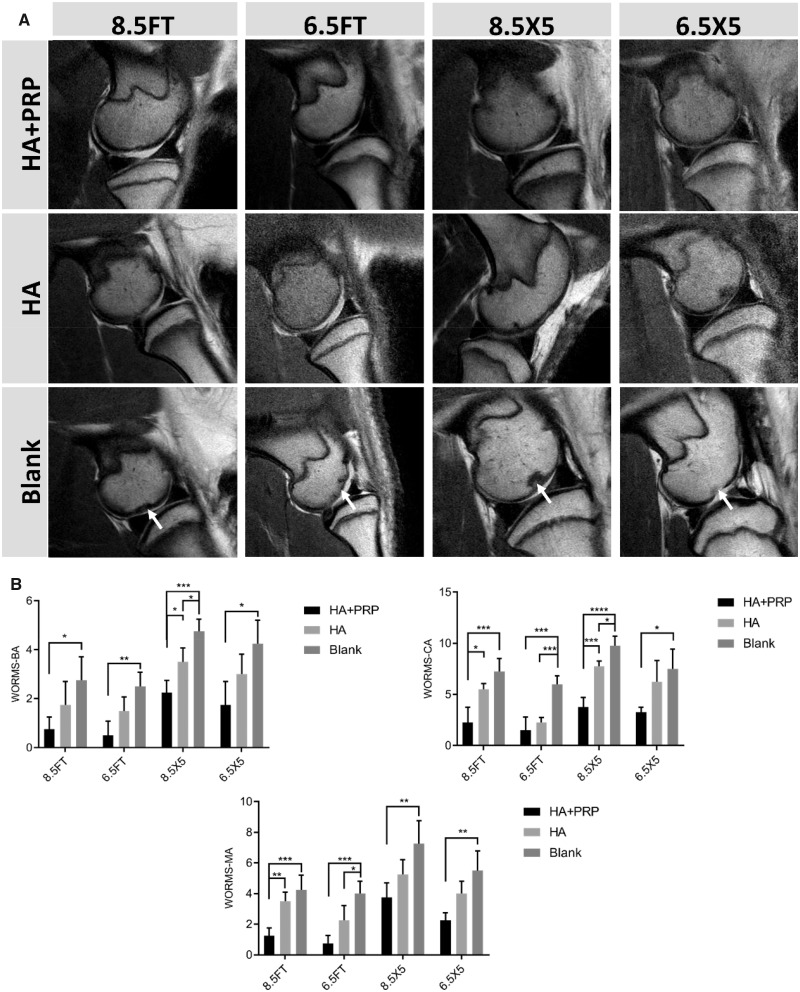
Figure 3.
(A) The high-resolution magnetic resonance imaging of articular cartilage in the sagittal plane. From left to right, the arrows indicated abnormal subchondral bone marrow signal, diffused cartilage erosion, subchondral bone defect and cartilage defect. (B) The MRI ICRS-WORMS scoring of repaired tissue. WORMS-BA, WORMS-Bone attrition; WORMS-CA, WORMS-Cartilage; WORMS-MA, WORMS-Marrow abnormality. The results were represented as mean ± standard deviation. *P < 0.05; **P < 0.01; ***P < 0.0005; ****P < 0.0001

