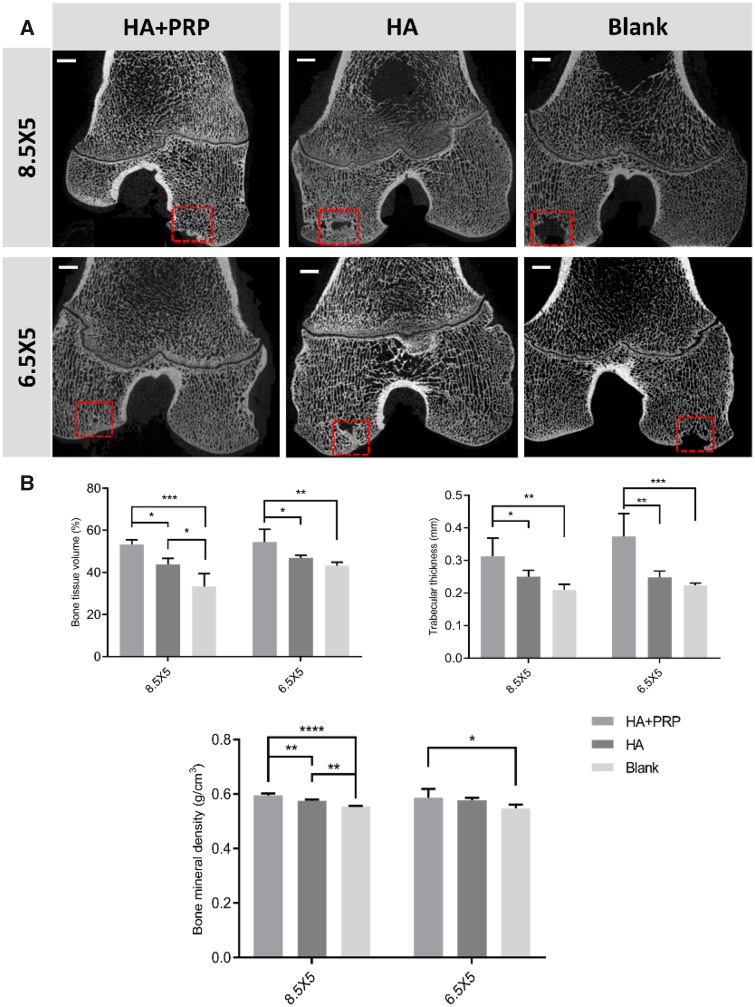
Figure 4.
The evaluation of subchondral bone reconstruction of osteochondral defects by µCT images (A) and the quantitative analysis of bone tissue volume (%); Tb.Th (mm) and bone mineral density (g/cm3). (B) The results were represented as mean ± standard deviation. *P < 0.05; **P < 0.01; ***P < 0.0005; ****P < 0.0001. Scale bar: 3 mm

