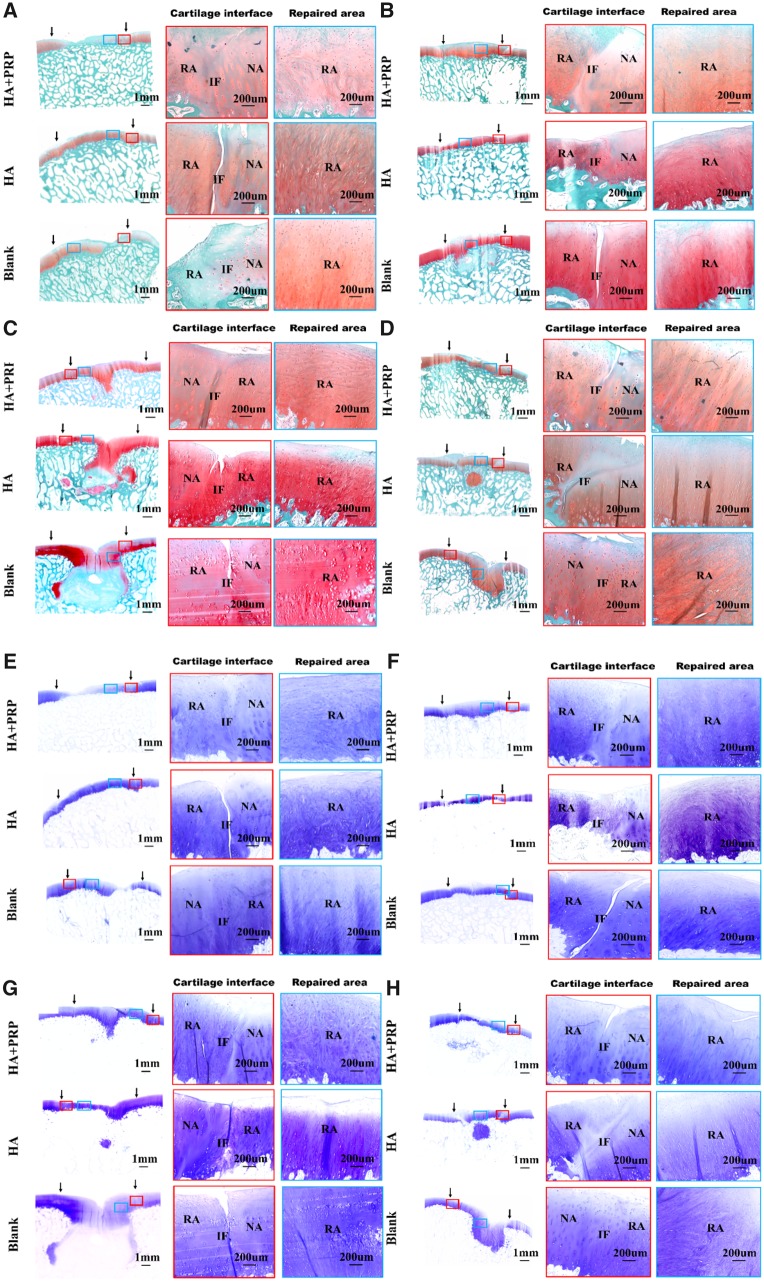
Figure 7.
Safranin O/fast green staining and toluidine blue staining of repaired tissue showing the cartilage interface and repaired area. (A–D) Safranin O/fast green staining. (E–H) Toluidine blue staining. (A, E) FT cartilage defects with 8.5 mm in diameter. (B, F) FT cartilage defects with 6.5 mm in diameter. (C, G) Osteochondral defects with 8.5 mm in diameter and 5 mm in depth. (D, H) Osteochondral defects with 6.5 mm in diameter and 5 mm in depth. NA, native area; IF, interface; RA, repaired area. Black arrows indicated repaired area

