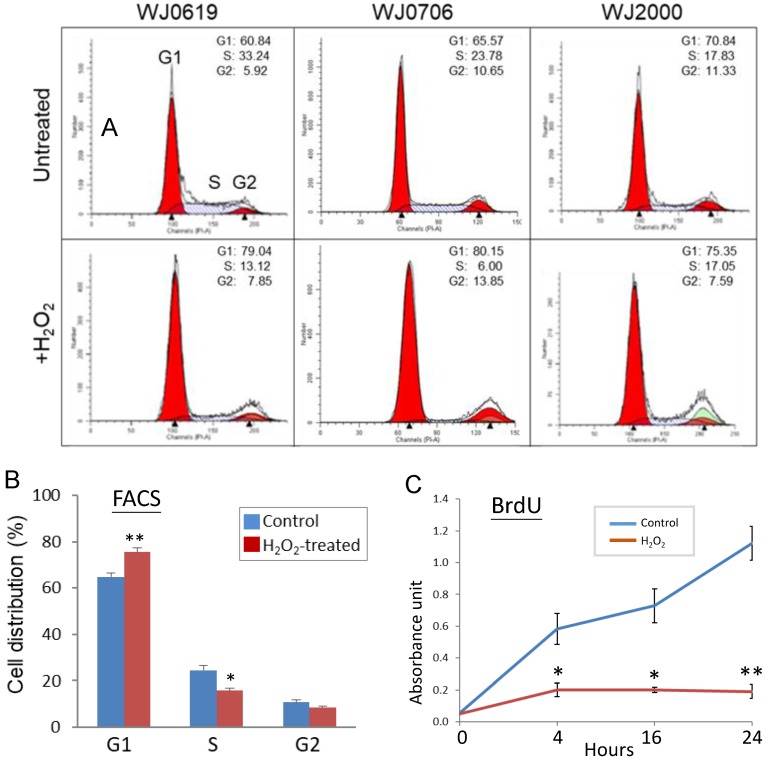
Figure 3.
Oxidative stress suppresses G1-to-S-phase transition of the cell cycle and DNA synthesis. (A, B) Effects of H2O2 treatment on G1/S transition. In the flow cytometry analysis, a representative dataset of the of the three cell lines tested after treatment with 200 µM H2O2 for 2 h is shown in (A); the mean values of three independent experiments and combining data of the three cell lines is shown in (B). (C) DNA synthesis rate of H2O2-treated cells determined by BrdU assays at different time points. All the data shown are the means of three independent experiments. *p<0.05 and **p<0.01 were relative to the untreated cells.

