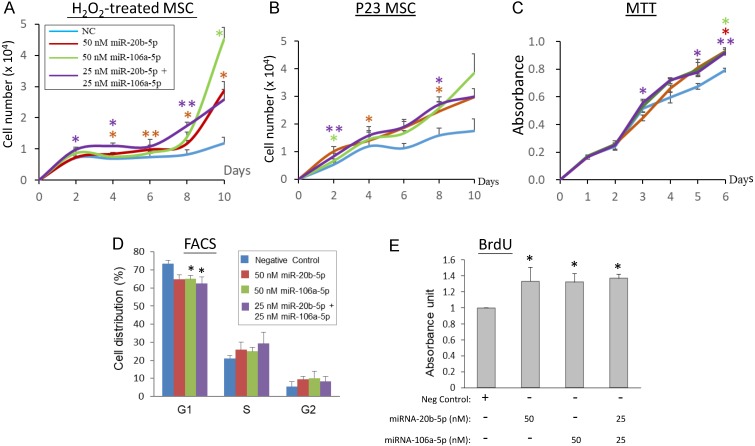
Figure 4.
MiR-20b-5p and miR-106a-5p promote cell proliferation, G1/S transition and DNA synthesis. (A, B) Effects of over-expression of miRNA mimics on cell growth in H2O2-treated (A) or late-passage (P23) replicative senescence (RS) WJ0706 cells (B). (A) Transfection of miRNA mimics was performed for 24 h, followed by 200 µM H2O2 treatment for 2 h before the cells were washed and cultured in fresh medium without H2O2. Cells were counted on the specified days post treatment. (B) Growth curve of miRNA-transfected P23 RS cells without H2O2 treatment. (C - E) Effects of over-expression of the miRNA mimics in WJ0706 cells on cell viability, determined by MTT analysis (C), distribution of G1-, S- and G2-phase cells, determined by flow cytometry (FACS) analysis (D), and DNA synthesis rate, determined by BrdU analysis (E). In (A-C), only the top halves of the error bars are shown; asterisks shown in different colors indicate statistical significance matching the different experimental curves of the same colors. The color codes for the miRNA transfection shown in (A) also apply to (B) & (C). The blue curves are the no-miRNA transfection negative controls. Data presented were from three independent experiments. *p<0.05 and **p<0.01 were relative to the nonspecific negative control (NC) mimic.

