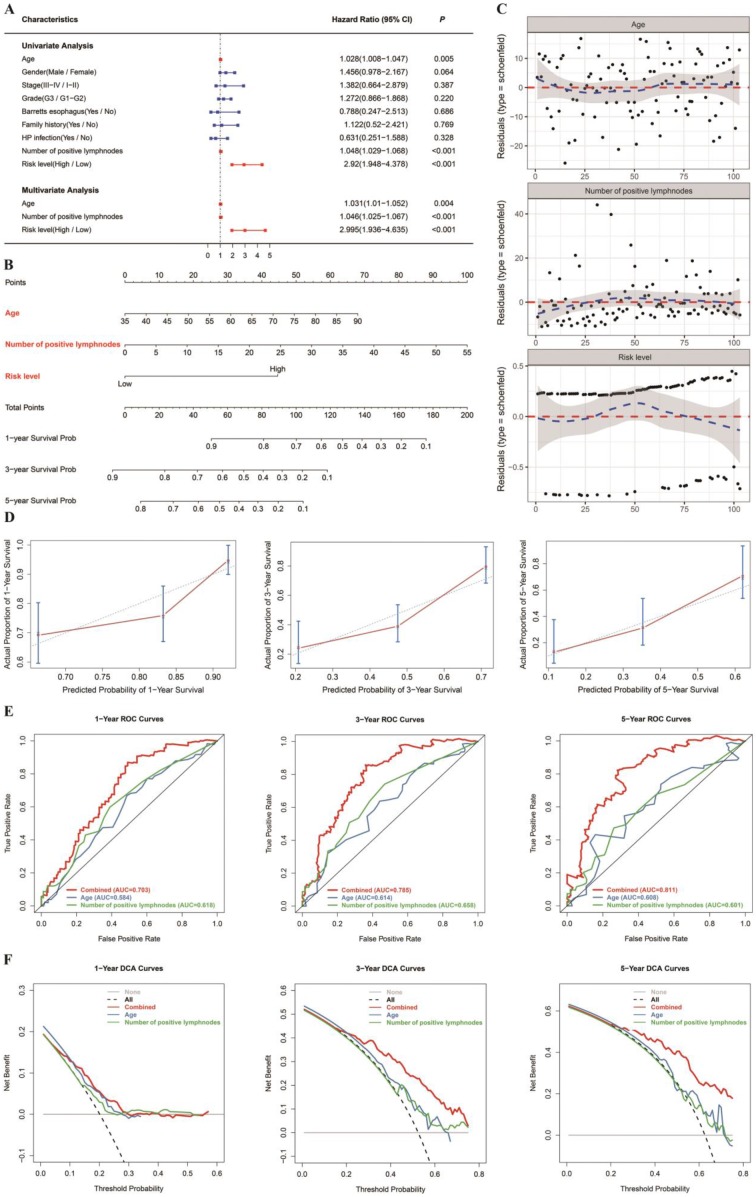
Figure 4.
Nomogram to predict 1-, 3- and 5-year OS. The OS nomogram was developed in the TCGA cohort, with age, number of positive lymph nodes and risk level (DNAm signature) incorporated. (A) Univariate and multivariate analyses of the risk level, clinical factors and pathological characteristics with OS. The statistical significance level is indicated by different colors; red indicates statistical significance, and blue indicates no significance. (B) Nomogram to predict the 1-, 3- and 5-year OS of GC patients. (C) The Schoenfeld residual suggested that this model met the equally proportional risk hypothesis. Schoenfeld model residuals vs age, number of positive lymph nodes and risk level were plotted to obtain a preliminary assessment of which of these predictive factors should be incorporated into the model. (D) Calibration curves of 1‐, 3‐ and 5‐year OS. Blue dotted lines represent the ideal predictive model, and the red solid line represents the observed model. (E) Time‐dependent ROC analysis was used to evaluate the accuracy of the OS nomograms. The red, blue and green solid lines represent the combined model, age, and number of positive lymph nodes, respectively. (F) DCA curves evaluate OS nomograms from the perspective of clinical benefit and scope of clinical benefits. The y-axis represents the net benefit. The x-axis represents the predicted OS probability. The black dotted line represents the condition that all patients survive in 5 years, while the gray solid line represents the condition that none of the patients survive for more than one year. In the current study, the decision curve showed more benefit with a threshold probability > 0.0% using the OS nomogram.

