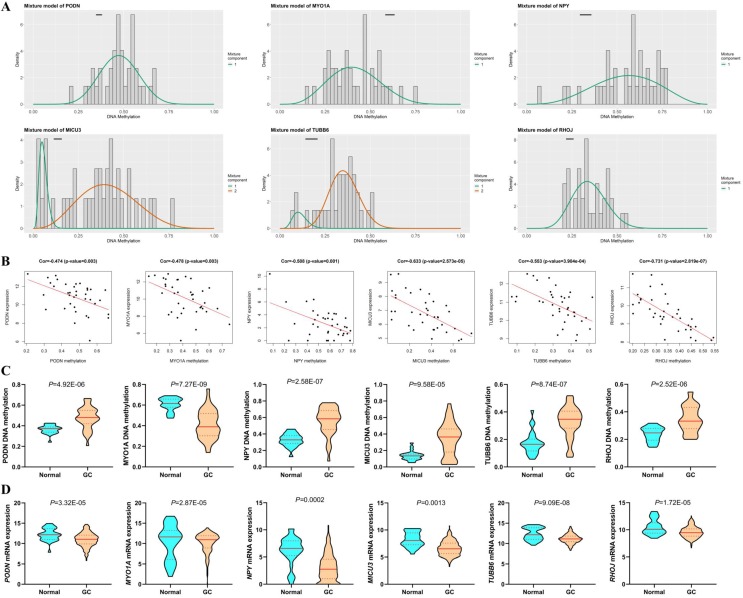
Figure 6.
DNAm-driven genes. (A) Differential methylation statuses. The histogram demonstrates the distribution of PODN, MYO1A, NPY, MICU3, TUBB6 and RHOJ methylation in GC samples. Beta values represent the methylation level (range from 0 to 1), and the horizontal black bar indicates the distribution of methylation values in the nontumorous gastric samples. (B) Regression analysis between the mRNA level and DNAm level of the six DNAm-driven DEGs. The vertical axis and the horizontal axis denote the mRNA level and DNAm level, respectively. (C) DNA methylation of the six DNAm-driven DEGs. (D) mRNA expression of the six DNAm-driven DEGs.

