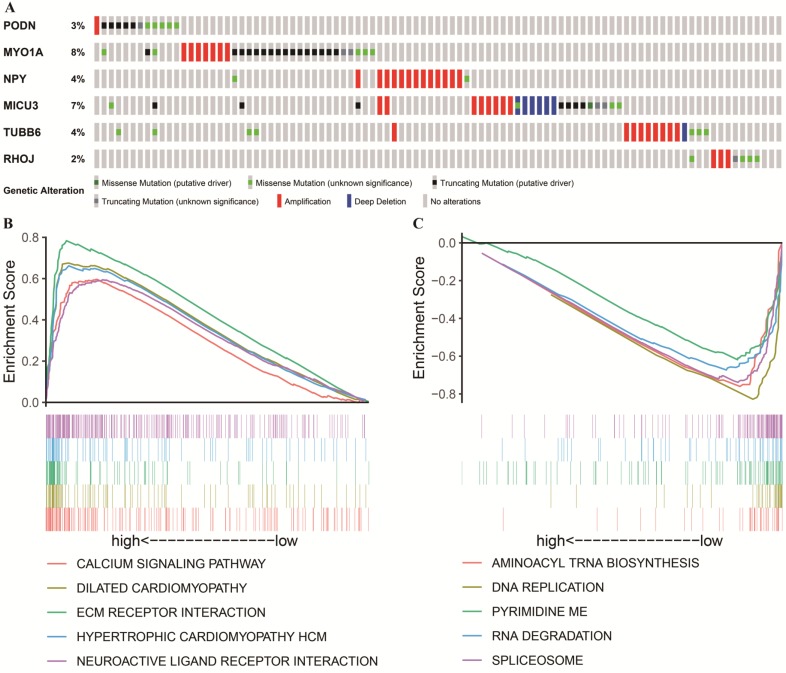
Figure 7.
Genetic alterations and mutation characteristics of DNAm-driven DEGs and GSEA. (A) Genetic alterations of DNAm-driven DEGs in GC samples. The rows and columns indicate the genes and tumor samples, respectively. (B, C) Enrichment plots of the top five KEGG pathways in the high-risk score (Figure 7B) and low-risk score (Figure 7C) groups in GC.

