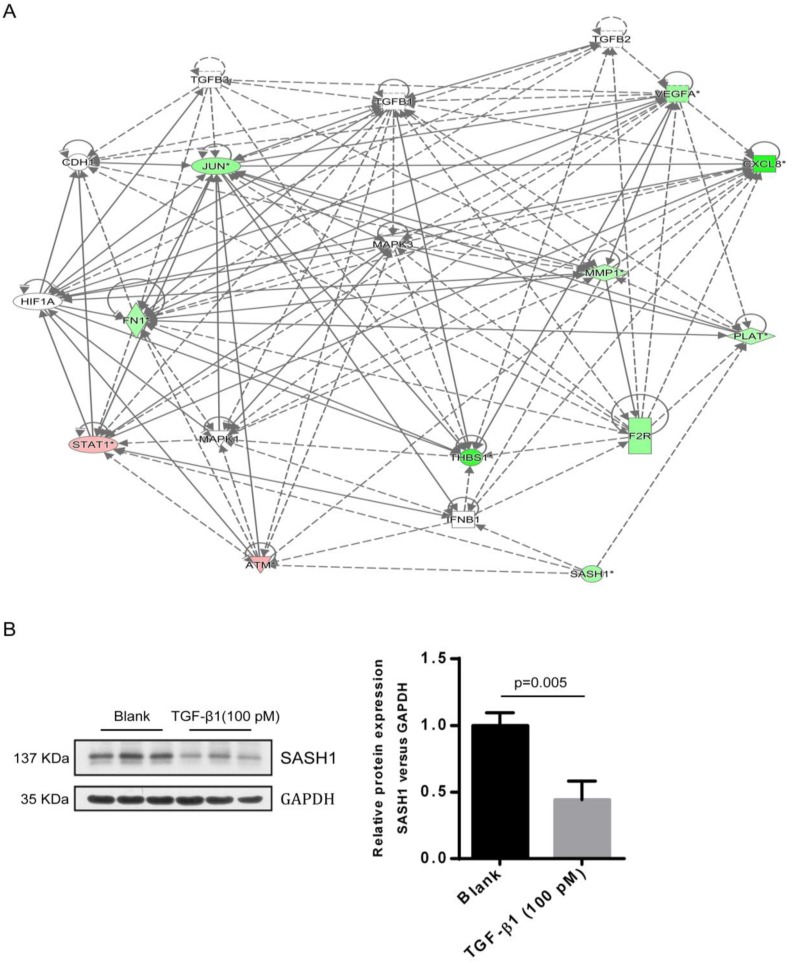
Figure 4.
A interaction between SASH1 and TGF-β1 signaling were identified by bio-informatics analysis and western blot. (A) Interaction analysis illustrated the interrelationships among the molecules mainly affects cell migration. The data presented in red/green represent the up-/down-regulated expression, solid lines and arrow represent direct activation. (B) Western blot analysis of SASH1 protein expression in PIG1 cells treated with TGF-β1.

