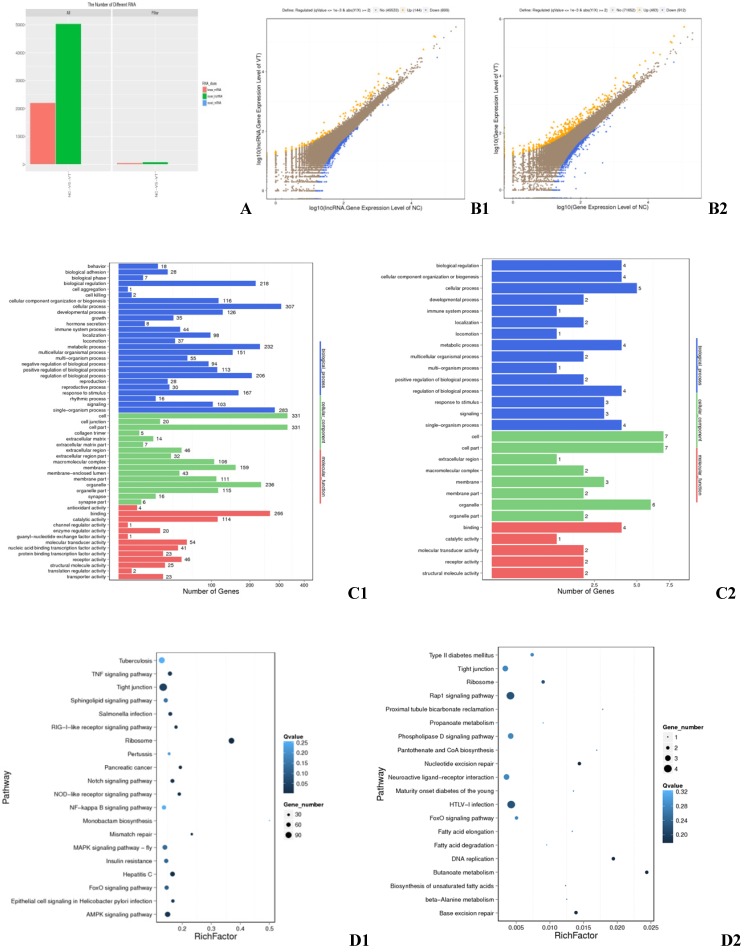
Fig 1.
Differentially expressed genes in the exosomes of infected and control HD11 cells. (A) All mRNAs and lncRNAs DE between the negative control (NC) and virus-injected (VT) groups. X axis: Difference scheme, Y axis: Numbers of RNAs, Colors: Classification of RNAs. (B) Differential expression of genes between the NC and VT groups. B1: mRNA, B2: lncRNA. X axis: compare the gene expression quantity of a certain sample with logarithm of the expression quantity; Y axis: compare the gene expression quantity of another copy in the scheme, and take logarithm of the expression quantity; Colors: blue indicates down-regulation, orange indicates up-regulation, and brown indicates non-significant difference. (C) GO annotation of DEGs between the NC and VT groups. C1: DEGs, C2: differential target genes. X axis: Number of genes, Y axis: GO item, color: GO category. (D) KEGG pathway analysis of DEGs between the NC and VT groups. D1: DEGs, D2: differential target genes. X axis: enrichment factor, Y axis: pathway, Color: p value size, Size: number of genes.

