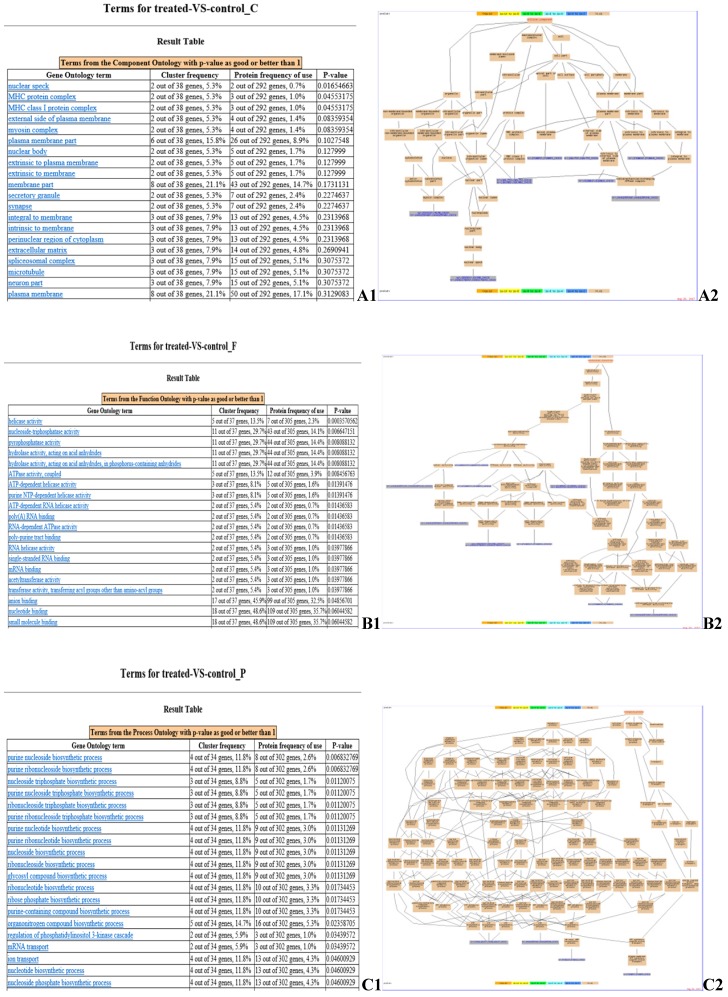
Fig 4.
GO enrichment analysis of identified DEPs. Cluster frequency indicates the ratio of annotation of the same GO term between all DEPs and all proteins identified. (A) Gene ontology analysis of the proteins in cellular component. A1: GO enrichment results screenshot, p-value <0.05 is a significantly enriched GO entry; A2: Genes annotated to the term. (B) Gene ontology analysis of the proteins in molecular function. B1: GO enrichment results screenshot, p-value <0.05 is a significantly enriched GO entry; B2: Genes annotated to the term. (C) Gene ontology analysis of the proteins in biological process. C1: GO enrichment results screenshot, p-value <0.05 is a significantly enriched GO entry; C2: Genes annotated to the term.

