Figure 2.
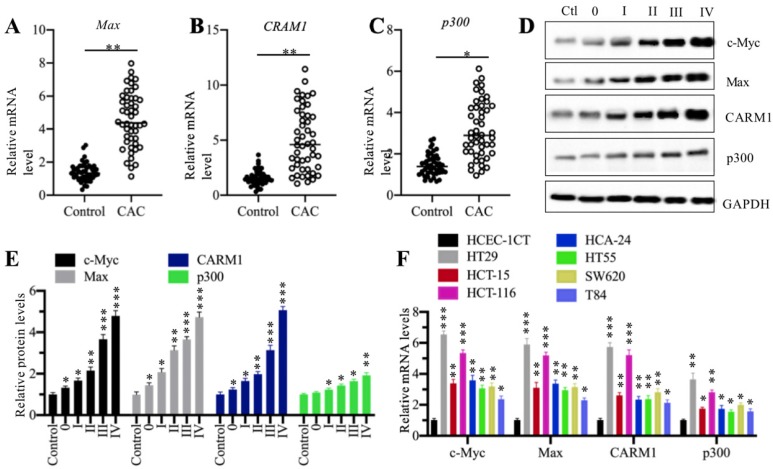
The CPCM components were amplified in CRC patients. (A-C) The relative mRNA levels of Max (A), CARM1 (B) and p300 (C) in 48-paired cancerous tissues (CAC) and their adjacent noncancerous tissues (Control) were determined by qRT-PCR. *P < 0.05 and **P < 0.01. (D) The protein levels CPCM components in tumor samples. Five tumor samples from CAC patients at different TNM stages (0-IV) and one noncancerous volunteer donor (HC) were applied to western blotting assay to determine protein levels of c-Myc, Max, CARM1, and p300. GAPDH was set as a loading control. (E) The relative protein levels of CPCM components. The protein band signals in (D) were quantified using the Image J software and normalized to GAPDH. *P < 0.05, **P < 0.01 and ***P < 0.001. (F) The mRNA levels of CPCM components in CRC cell lines. Seven CRC cell lines including HT29, HT55, HCT-15, HCT-116, HCA-24, SW620 and T84, and one normal HCEC-1CT cell line were used to examine mRNA levels of c-Myc, Max, CARM1, and p300. *P < 0.05, **P < 0.01 and ***P < 0.001.

