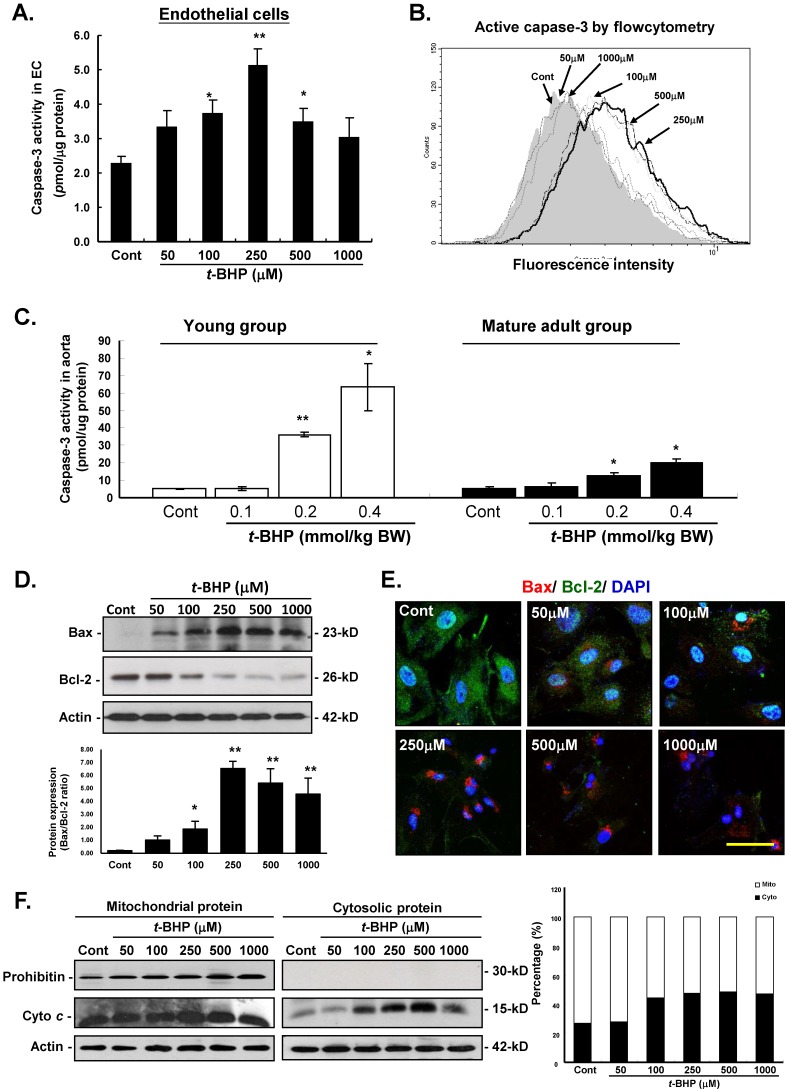
Figure 4.
Effects of tert-butyl hydroperoxide (t-BHP) on intrinsic pathway of apoptosis. (A) Caspase-3 colorimetric analysis in rat aortic endothelial cells (ECs). The caspase-3 activity t-BHP was significantly elevated (250 μM) by 2.24-fold, compared with the Cont. (B) Flow cytometric study in ECs. Cells treated with t-BHP expressed higher caspase-3 activity (peak of caspase-3 activity deviating to the right). (C) Caspase-3 activities in aortic tissues. Higher doses of t-BHP (0.2 and 0.4 mmol/kg BW) amplified capspase-3 activities by 7.1 and 12.5 fold (the young group) and 2.4 and 3.8 fold (the mature adult group), compared with the Cont groups. Data were from six animals in each group and three independent experiments were performed in triplicate from cells. Data were represented with mean ± S.E.M. * p<0.05, and ** p<0.01. (D) Immunoblotting analysis of Bax and Bcl-2 proteins of the Bcl-2 family. t-BHP substantially up-regulates the crucial pro-apoptotic factors (Bax) and down-regulates the key anti-apoptotic proteins (Bcl-2). Quantitative results confirmed the increased Bax-to-Bcl-2 ratio in ECs treated with t-BHP. Representative sets of data were from three independent experiments and Actin was used as a loading control. The density of Bax/Bcl-2 ratio was converted to grayscale value and normalized to Cont. * p<0.05, and ** p<0.01. (E) Immunofluorescence analyses of the cellular distribution of Bcl-2 (green fluorescence) and Bax (red signals) proteins in ECs. Increased expression of Bax and decreased expression of Bcl-2 could be clearly observed in t-BHP-treated ECs at concentration higher than 250 μM. Blue color represents cell nuclei counterstained with DAPI. Scale bar indicated as 10 μm. (F) Immunoblotting study of mitochondrial and cytosolic cytochrome c. The ample presence of a specific mitochondrial marker, prohibitin, in the mitochondrial extracts and absence of this marker in the cytosolic fractions (upper lane) demonstrates the relative purity of both protein fractions. The abundance of cytochrome c was increased in the cytosol (right panel, lane 2) in t-BHP-treated ECs at concentration higher than 100 μM. On the right, summary data on the cellular distribution of cytochrome c are presented. Mito, mitochondrial fraction of cytochrome c; Cyto, cytosolic fraction of cytochrome c.

