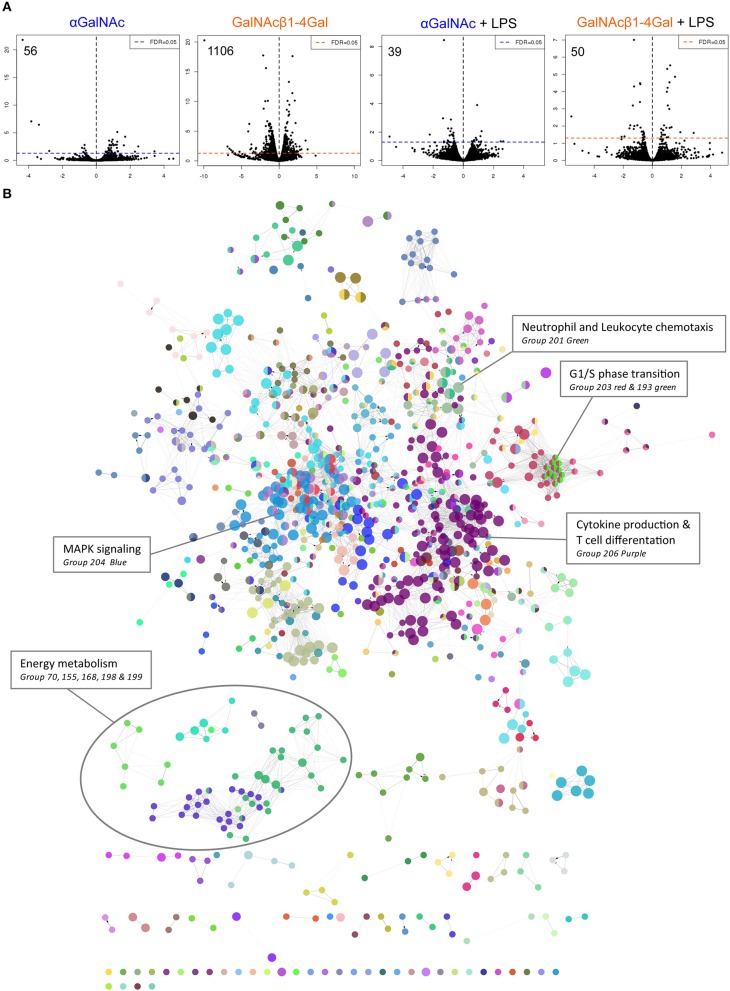
Figure 2.
GalNAcβ1-4Gal stimulation strongly alters moDC transcriptional activity. (A) Gene expression analysis of moDCs stimulated with αGalNAc (blue) or GalNAcβ1-4Gal (orange) glycodendrimers for 4 h in the presence or absence of LPS. Depicted are the fold change (x-axis) and FDR-adjusted p-values in a minus log 10 transformation (y-axis). (B) GO term enrichment analysis was performed on the 1106 differentially expressed genes (DEGs) of GalNAcβ1-4Gal-stimulated moDCs. Gene sets defined by significantly enriched GO terms were visualized as nodes, connected lines represent overlapping genes between gene sets. Coloring was based on GO groups defined by the software. Results of the GO term enrichment analysis are also listed in Table S5.

