Figure 4.
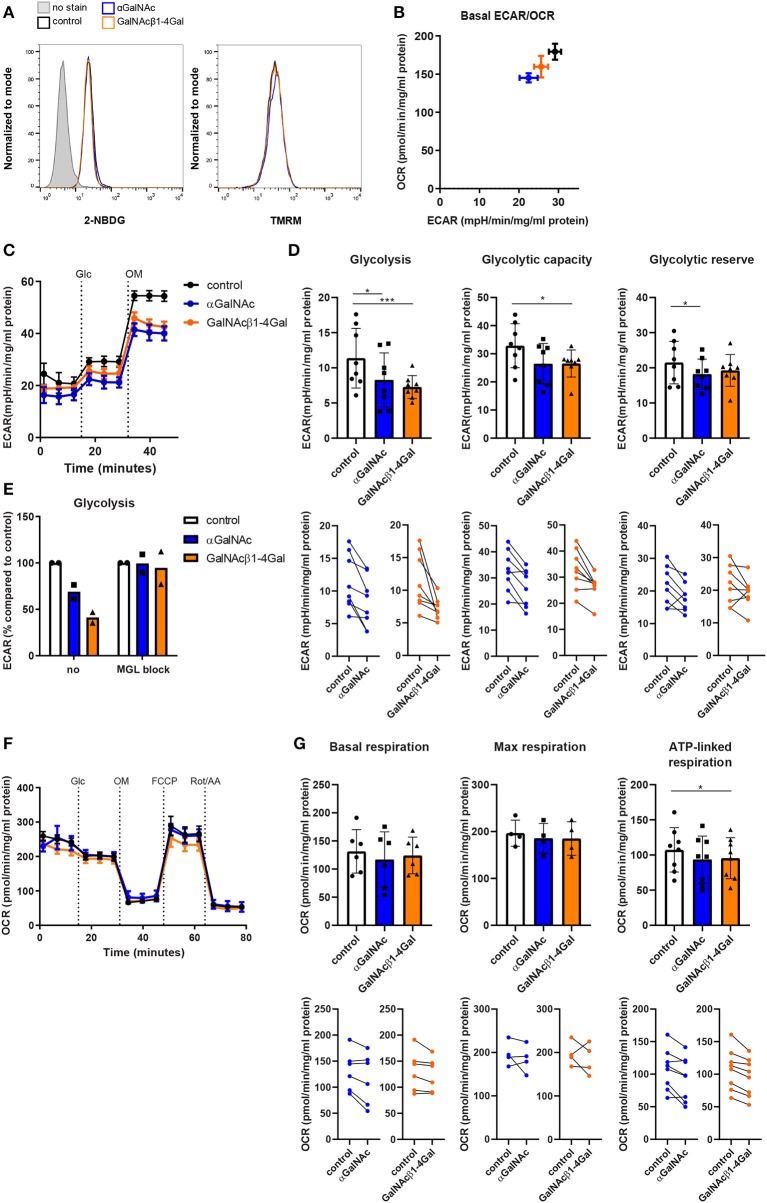
MGL ligation suppresses the glycolytic activity in moDCs. (A) Glucose uptake (2-NBDG staining, left) and the mitochondrial membrane potential (TMRM staining, right) of moDCs stimulated overnight with αGalNAc (blue), GalNAcβ1-4Gal (orange), or control (black) glycodendrimers. Data was analyzed by flow cytometry. One representative of 2–4 independent experiments is shown. (B–G) moDCs were stimulated overnight with αGalNAc (blue), GalNAcβ1-4Gal (orange), or control (black) glycodendrimers and subsequently subjected to extracellular flux analysis. Data was normalized based on protein content. (B) Basal extracellular acidification rate (ECAR) and oxygen consumption rate (OCR) were measured after glucose addition. One representative of five independent experiments is depicted. (C) During extracellular flux analysis, ECAR in response to treatment with Glucose (Glc) and Oligomycin (OM) was measured. One representative of eight independent experiments is depicted. Error bars represent standard deviation of 4–6 technical replicate measurements. (D) Glycolysis, glycolytic capacity, and glycolytic reserve were determined using the ECAR levels before and after treatment with Glc and OM (n = 8). Individual donors are depicted in the line graphs (lower panels). (E) Glycolysis was determined in moDCs stimulated with the different glycodendrimers both in the absence or presence of anti-MGL blocking antibodies. ECAR of moDCs stimulated with control glycodendrimers was set to 100%. (F) During extracellular flux analysis, OCR in response to treatment with Glc, OM, FCCP, and rotenone plus antimycin A (Rot/AA) was measured. One representative of six independent experiments is depicted. Error bars represent standard deviation of 4-6 technical replicate measurements. (G) Basal respiration, maximal respiration and ATP-linked respiration were determined using the OCR levels before and after treatment with OM, FCCP and Rot/AA. Error bars represent standard deviation of 4–8 independent experiments. Individual donors are depicted in the line graphs (lower panels). *p < 0.05; ***p < 0.001.

