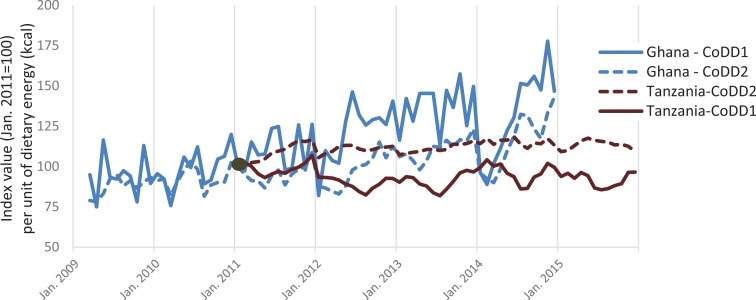
Figure 3.
Cost of diet diversity indexes for Ghana and Tanzania, 2009–2015 (January 2011 = 100).
Source: Index values shown represent changes in the cost of meeting energy needs from diverse food groups, when using the lowest-priced food in each food group as defined for the minimum dietary diversity for women (MDD-W) indicator. CoDD1 shows the cost of reaching five food groups, and CoDD2 shows the average cost of including all available groups. Which foods and food groups are included in this minimally diverse diet varies over time and space. Data shown here are relative to Jan. 2011 prices in real USD/kcal.

