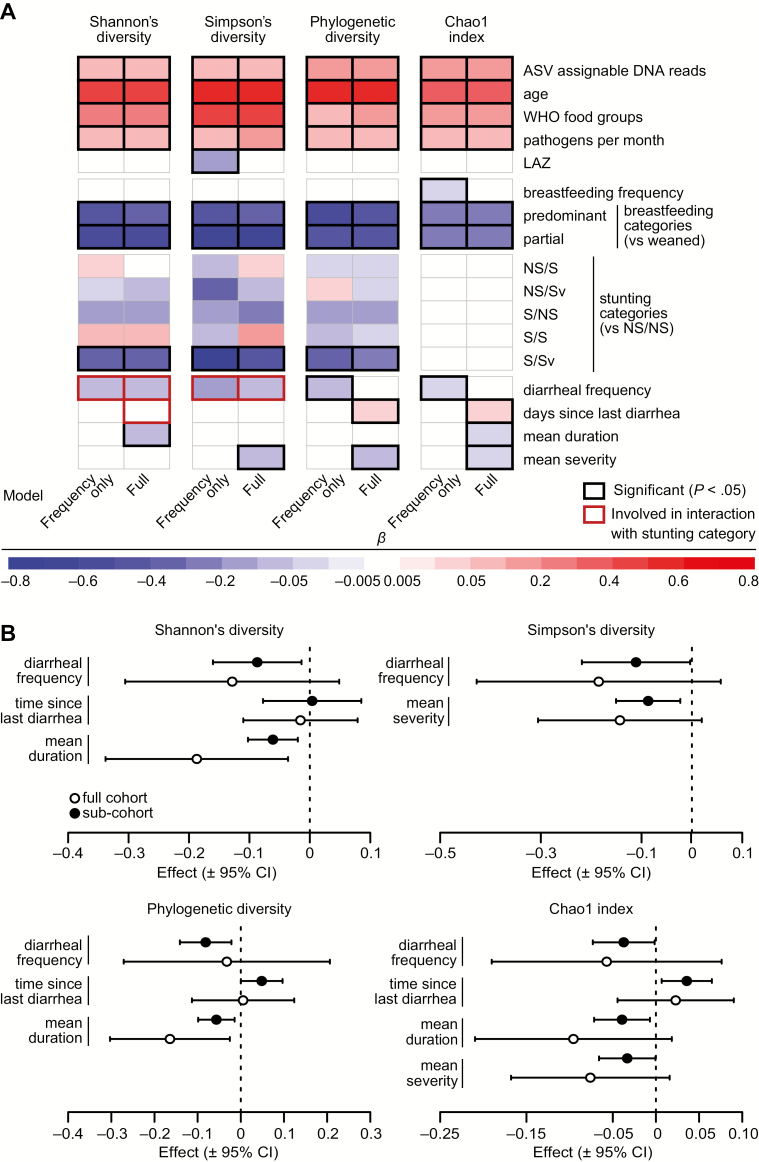
Figure 3.
Results of linear mixed-effects models testing associations between metrics of gut bacterial diversity and richness and measures of growth, feeding history, and health. A, Heat map showing the effects of diet, the indicated health parameters, and diarrheal variables on fecal bacteria diversity metrics, as estimated in the frequency-only and full models. The coefficients represent changes in standard deviations for Shannon's diversity and phylogenetic diversity, log values for the Chao1 index, and logit-transformed values for Simpson's diversity expected from a 1-standard deviation increase in continuous predictors and differences between the indicated group for breastfeeding and stunting categories. For effects of diarrheal variables involved in interactions with stunting category (in red boxes), the coefficient shown represents the overall mean effect. For the effects in all stunting categories, see Figure 3 and Supplementary Figure 1. B, Forest plots showing the effects of diarrheal frequency, duration, severity, and time since diarrhea on gut bacterial diversity metrics in the full cohort and subcohort analyses. Effects are shown in the same scale as in the heat map of panel A. Abbreviations: ASV, amplicon sequence variant; CI, confidence interval; LAZ, length-for-age z-score; NS/NS, not born stunted, not stunted at the time of sampling; NS/S, not born stunted, stunted but not severely stunted at sampling; NS/Sv, not born stunted, severely stunted at sampling; S/NS, born stunted/not stunted at sampling; S/S, born stunted, stunted but not severely stunted at sampling; S/Sv, stunted and severely stunted at sampling; WHO, World Health Organization.

