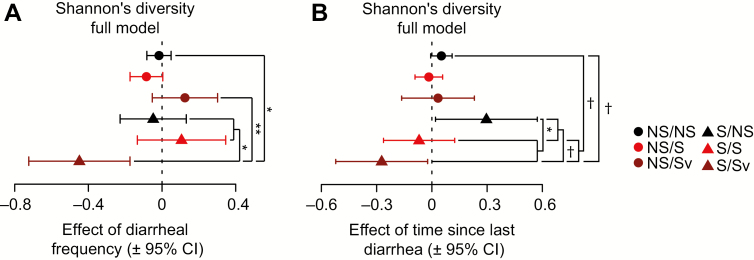
Figure 4.
Effects of diarrheal variables on Shannon's diversity by stunting category in full models. A, Forest plots showing the effects of diarrheal frequency and (B) time since diarrhea on Shannon's diversity, and indicated significant comparisons between groups in post hoc planned linear contrasts. P values were corrected using Holm's method. Abbreviations: CI, confidence interval; NS/S, not born stunted, stunted but not severely stunted at sampling; NS/Sv, not born stunted, severely stunted at sampling; S/NS, born stunted/not stunted at sampling; S/S, born stunted, stunted but not severely stunted at sampling; S/Sv, stunted and severely stunted at sampling. †P < .1; * P < .05; ** P < .01.

