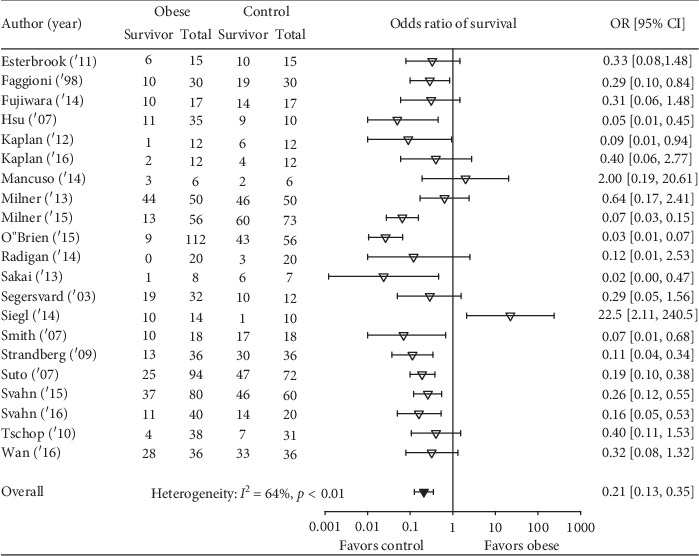
Figure 2.

The number of total and surviving animals in obese and control groups for each of the 21 analyzed studies and the effects of obesity on the odds ratios (OR (95% CI)) of survival for each study. Also shown is the OR (95% CI) for the 21 studies and the associated I2 and its level of significance.
